Videos
In an experiment published in the journal Cell in 2014, Amnon Koren and Steven McCarroll isolated two populations of growing tissue culture cells from each of two unrelated people from different parts of the world.
One population from each person consisted of millions of cells that were in G of the cell cycle; the other population was a similar number of cells that were in S phase for various amounts of time. The scientists then performed high-throughput DNA sequencing on these cell populations.
The two graphs that follow show the data for the two individuals. In each graph, the x-axis represents positions along a chromosome (here, chromosome 8), and the y-axis represents the ratio between the number of reads obtained for a given region of the genome from the S phase sample divided by the number of reads obtained for the same region from the G sample. Each small purple dot is 2 kb along the chromosome; the black line is the moving average of the purple.
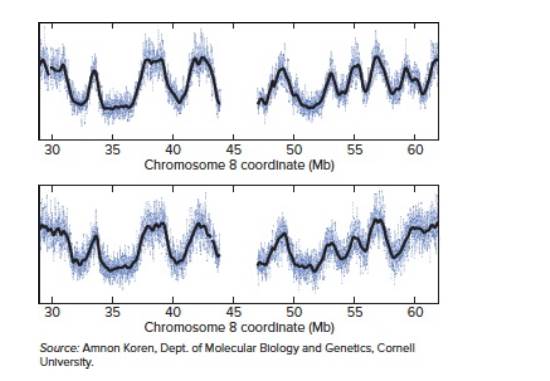
| a. | At chromosomal coordinate 33 Mb, the y-axis value is much higher than at coordinate 35 Mb. What does this fact tell you about the timing of |
| b. | Scientists still do not have a good idea about the nature of DNA sequences or chromatin structures that define origins of replication in human cells. If you were trying to locate such origins of replication, where would you look? |
| c. | Suppose you did a similar experiment using two populations with the same number of cells, one population in G and the other in G . If you graphed the data in a similar fashion, with the y-axis representing the ratio of the number of reads from the G sample divided by the number of reads from the G sample, what would the plot look like? |
| d. | The patterns for these two people are very nearly the same, even though they are completely unrelated. What does this fact suggest? |
| e. | These scientists later reasoned that they could obtain the same kind of information from any person whose genome had been sequenced by high-throughput methods, without separating out populations of cells at different cell cycle stages. What would have to be true about the cells analyzed and the kinds of data available? Why would you want to look at this data from many different people? |
Want to see the full answer?
Check out a sample textbook solution
Chapter 12 Solutions
Genetics: From Genes to Genomes


- 8) You perform flow cytometry on a population of cells treated with a mutagen to identify new factors required for cell cycle progression. You isolate two new mutants that display a change in the rate of the cell cycle. You measure DNA content with flow cytometry from a control cell population as well as from these two mutants. The results from this experiment are shown below. Control Mutant 1 Mutant 2 1 Relative amount of DNA per cell Use these data to answer the following questions. 1) If you measured levels of M-cyclin protein from these different populations, which would have the HIGHEST. a. Control b. Mutant 1 c. Mutant 2 2) After genome sequencing, you identify a loss-of-function mutation in Cdc20 in one of these cell populations. Based on these data, which population would you expect to have this mutation? a. Mutant 1 b. Mutant 2 3) If DNA damage is sensed during replication and cell cycle progression is stopped, which of the graphs would you expect to observe? a. Control b.…arrow_forwardSuppose the experiment of Meselson and Stahl was performed on a sample of 8 cells, each containing one copy of its circular double-stranded DNA genome, and that had been growing on normal 14N medium. You then grew the cells for 3 generations in medium containing 15N. The outcome would be A) 8 cells with single-stranded DNA molecules with 14N, and 24 cells with single-stranded DNA molecules with 15N. B) 16 cells with double-stranded DNA molecules with equal amounts of 14N and 15N, and 48 cells with double-stranded DNA molecules with 15N. C) 8 cells with double-stranded DNA molecules with equal amounts of 14N and 15N, and 24 cells with double-stranded DNA molecules with 15N. D) 8 cells with double-stranded DNA molecules with equal amounts of 14N and 15N, and 32 cells with double-stranded DNA molecules with 15N. E) 65 cells with single-stranded DNA molecules with 15N.arrow_forwardIn 1997, Dolly the sheep was cloned by a technique called somatic-cell nuclear transfer (or nuclear-transfer cloning). A nucleus from an adult mammary cell was transferred into an egg from which the nucleus had been removed. The egg was allowed to divide several times in culture, then the embryo was transferred to a surrogate mother who gave birth to Dolly. Dolly died in 2003 after mating and giving birth herself to viable offspring. What does the creation of Dolly tell us about the potential of nuclear material derived from a fully differentiated adult cell? Does the creation of Dolly tell us anything about the potential of an intact, fully differentiated adult cell?arrow_forward
- Suppose you isolated a mutant strain of yeast that replicates its DNA more than once per cell cycle. In other words, each gene in the genome was replicated several times between successive cell divisions. How might you explain such a phenomenon?arrow_forwardWhat have scientists discovered about the limiting factors that control how many times a cell can replicate itself and divide? Question 10 options: a) Telomeres do not play a role as a limiting factor. b) Telomeres get longer the more times a cell has replicated and divided. c) When telomeres become too short (or disappear), a cell stops dividing. d) None of the abovearrow_forwardTo identify genes controlling the cell cycle in budding yeast, a genetic screen was carried out. In this screen, haploid yeast cells were exposed to a DNA damaging agent to introduce random mutations in the genome. By culturing cells at an elevated temperature (e.g. 37 degrees), where many mutated genes lose their function, scientists identified yeast mutants that showed growth defects and arrest at specific stages of the cell cycle (e.g. in mitosis with large buds). In this screen, mutants of the cyclin-dependent kinase were identified, but not mutants of cyclins. Explain the reason for this outcome.arrow_forward
- The diagram below represents single-celled organism A dividing by mitosis to form cells B andC. B cکړ Cells A, B, and C all produced protein X. What can best be inferred from this observation? A) The gene to produce protein X was passed from cell A to cells B and C. B) Cells A, B, and C ingested food containing the gene to produce protein X. C) The gene for protein X is found in single-celled organisms, only. D) Protein X is found in all organisms.arrow_forwardA panel of cell lines was created by human–mouse somatic-cell hybridization. Each line was examined for the presence of human chromosomes and for the production of an enzyme. The following results were obtained:arrow_forwardDo a few cells created by therapeutic cloning of your own somatic cells constitute life? If these cells do constitute life, do they have the same rights as a human being conceived naturally? If it were possible, should someone be allowed to grow his or her own therapeutic clone into an adult?arrow_forward
- The microscope image above shows the human chromosomes from a white blood cell. To create the image, researchers put cells in culture under conditions that encourage the cells to divide. They bathed the cells in a hypotonic (low salt) solution, which caused the cells to swell until their plasma membrane burst open. They "squashed" the chromosomes to spread them out, and stained them with a dye to make them visible under the microscope. Human chromosomes are numbered from longest (1) to shortest (22) plus the sex chromosomes X and Y. In the image chromosome 1 is about 7 micrometers. Answer the following questions. 1) What word(s) in the description above indicates that the chromosomes are not from a cell undergoing meiosis? 2) Based on the size, shape and appearance of the chromosomes in the image, in what cell cycle stage was the cell that the chromosomes came from? How can you tell? 3) Does the image suggest that centromere sequences are always located in the middle of a…arrow_forward1) Scientists isolate cells in various phases of the cell cycle. They isolate a group of cells that have 1.5 times more DNA than G1 phase cells. What is the most likely part of the cell cycle from which these cells were isolated? A) in the G2 phase of the cell cycle. B) between the G1 and S phases in the cell cycle C) in the late M phase of the cell cycle D) in the S phase of the cell cycle 2) Which of the following statements is true regarding animal cell cytokinesis when compared to plant cell cytokinesis? A) The contractile filaments found in plant cells are structures composed of carbohydrates; the cleavage furrow in animal cells is composed of contractile proteins. B) Plant cells divide after metaphase but before anaphase; animal cells divide after anaphase. C) Animal cells form a cleavage furrow while plant cells deposit vesicles containing cell wall building blocks on the metaphase plate D) In animal cells, a cell membrane separates the two daughter cells; the structural…arrow_forwardIn the tracking chromosomal DNA movement through mitosis experiment, how many chromosomes did each of your daughter cells contain? Why is it important for each daughter cell to contain information identical to the parent cell? How often do human skin cells divide? Why might that be? Compare this rate to how frequently human neurons divide. What do you notice?arrow_forward
 Human Anatomy & Physiology (11th Edition)BiologyISBN:9780134580999Author:Elaine N. Marieb, Katja N. HoehnPublisher:PEARSON
 Biology 2eBiologyISBN:9781947172517Author:Matthew Douglas, Jung Choi, Mary Ann ClarkPublisher:OpenStax
 Anatomy & PhysiologyBiologyISBN:9781259398629Author:McKinley, Michael P., O'loughlin, Valerie Dean, Bidle, Theresa StouterPublisher:Mcgraw Hill Education,
 Molecular Biology of the Cell (Sixth Edition)BiologyISBN:9780815344322Author:Bruce Alberts, Alexander D. Johnson, Julian Lewis, David Morgan, Martin Raff, Keith Roberts, Peter WalterPublisher:W. W. Norton & Company
 Laboratory Manual For Human Anatomy & PhysiologyBiologyISBN:9781260159363Author:Martin, Terry R., Prentice-craver, CynthiaPublisher:McGraw-Hill Publishing Co.
 Inquiry Into Life (16th Edition)BiologyISBN:9781260231700Author:Sylvia S. Mader, Michael WindelspechtPublisher:McGraw Hill Education