Videos
The equivalent circuit in Figure 7.14 has circuit parameters
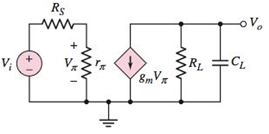
Figure 7.14 Figure for Exercise TYU 7.2
Want to see the full answer?
Check out a sample textbook solution
Chapter 7 Solutions
Microelectronics: Circuit Analysis and Design


- Design a 3 Band Equalizer based on the following requirements. Use standard component values on your circuit design. The design specification values have a tolerance of +/- 3% of the rated value for cut/boost while a tolerance of+/- 10% of the rated value for frequency valuesarrow_forwardWhat is the definition of resonant frequencies, cut-off frequencies, bandwidth, andquality factor of series and parallel RLC circuits.And how do you determine the circuit conditions at the resonant and cut-off frequencies. (Answer in long paragraph form)arrow_forwardExplain how the resonant frequencies, cut-off frequencies, bandwidth, andquality factor of series and parallel RLC circuits works.And how to determine the circuit conditions at the resonant and cut-off frequencies. (Answer in long paragraph form)arrow_forward
- Fill in your bole algebra training with karnaugh in the image.(Do not discount.)arrow_forwardFigures (a) to (e) below show the asymptotic Bode diagrams (magnitude and phase) of the constituent parts of five different open-loop transfer functions, ??(?). The Bode diagrams are colour coded. Write the transfer function corresponding to the pair of Bode plots in the space provided to the right of each figure. No need to show any working – just write the standard form of transfer function equation for each diagram. please help with b, c and darrow_forwardThe impedance value of an RLC circuit is 30 N (as maximum value), during a resonance with 60 Hz. BW is 20 Hz for the resonance point. a) Draw the circuit and calculate the R, L, C values. b) If we supply a signal with 50 Hz to this circuit, what do you think about the characteristic behavior of the circuit?arrow_forward
- Figures (a) to (e) below show the asymptotic Bode diagrams (magnitude and phase) of the constituent parts of five different open-loop transfer functions, ??(?). The Bode diagrams are colour coded. Write the transfer function corresponding to the pair of Bode plots in the space provided to the right of each figure. No need to show any working – just write the standard form of transfer function equation for each diagram. please help with c and darrow_forwardThe pulse function usually indicates an "on-off" switch and is usually represented in terms of the difference of two step functions. Given a pulse function in image a)Write ℎ(?) as a piecewise function and sketch the graph of ℎ(?). b) Determine the transfer function ?(?)arrow_forwardQ4. Consider the circuit shown in Figure P7.30. The time constant associated with Cc2 is a factor of 100 larger than the time constant associated with Cc1. (a) Determine CCi such that the -3 dB frequency associated with this capacitor is 20 Hz. (b) Find Cc2. Vcc=5 V R = 1.2 k2 Rs = 300 2 Ccz R2 = 1.2 k2 RE= 50 2 R= 10 2 Figure P7.30arrow_forward
- 7.8. Consider an FIR highpass filter design with the following specifications: Stopband 0-1,500 Hz Passband 2,000-4,000 Hz Passband ripple 0.02 dB Stopband attenuation 60 dB Sampling rate = 8,000 Hz Determine the following: a. window method b. length of the FIR filter c. cutoff frequency for the design equation following specifications:arrow_forwardInstructions: Transient analysis is with reference to step response. Peak overshoot is mentioned in per cent. Settling time is to be found out for 2% tolerance. Steady state error is to be computed in absolute magnitude (not in per cent). For frequency response analysis, if the cross-over frequency, the gain margin or the phase margin is unbounded or does not exist, then write the answer for that part as -1. Problem statement: A unity gain negative feedback control system is given with the plant transfer function G(s) = s(8 + 1)2 and a series compensator G_{c}(s)= k, where k>=0. Part A Consider the closed-loop system. 1. Steady state error e_{ss) = Using Routh array answer the following: 2. Maximum value of k for stability (kmarginal) = Part B For the control system described in Part A, Choose the value of the gain G c(s) = k = 64. For the dominant subsystem (of the closed-loop system) obtain the step response and answer the following: 3. Peak time T_p = 4. Settling time T_s = Part C…arrow_forward8. Write the mason's gain formula for signal flow graph and define each term. P = G(s) =EP AEarrow_forward
 Introductory Circuit Analysis (13th Edition)Electrical EngineeringISBN:9780133923605Author:Robert L. BoylestadPublisher:PEARSON
 Delmar's Standard Textbook Of ElectricityElectrical EngineeringISBN:9781337900348Author:Stephen L. HermanPublisher:Cengage Learning
 Programmable Logic ControllersElectrical EngineeringISBN:9780073373843Author:Frank D. PetruzellaPublisher:McGraw-Hill Education
 Fundamentals of Electric CircuitsElectrical EngineeringISBN:9780078028229Author:Charles K Alexander, Matthew SadikuPublisher:McGraw-Hill Education
 Electric Circuits. (11th Edition)Electrical EngineeringISBN:9780134746968Author:James W. Nilsson, Susan RiedelPublisher:PEARSON
 Engineering ElectromagneticsElectrical EngineeringISBN:9780078028151Author:Hayt, William H. (william Hart), Jr, BUCK, John A.Publisher:Mcgraw-hill Education,