
Concept explainers
Videos
(a)
To Explain: the five-number summary on the basis of given distribution.
(a)
Answer to Problem 2.45E
3,4,8,13,55
Explanation of Solution
Given:
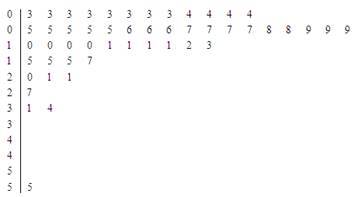
By seeing the stem-leaf plot minimum and maximum values are 3 and 55 respectively so the spread of the data will be 3 to 55. The 1st
(b)
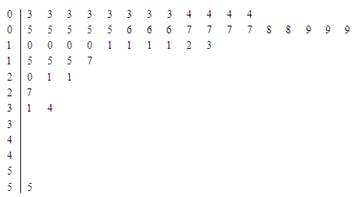
To Explain: the outlier if it is there, explain it with calculation
(b)
Answer to Problem 2.45E
Explanation of Solution
Given:

Formula used:
Calculation:
By seeing the stem plot and the calculation it indicates that there are 4 outliers which is 27,31,34,55 because all the larger than 26.5 and inter
(c)
To construct: the box plot on the basis of given data.
(c)
Explanation of Solution
Given:
Graph:
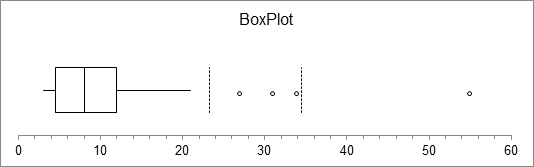
By seeing the box plot and the calculation it indicates that there are 4 outliers which is 27,31,34,55 because all the larger than 26.5 and one of them is extreme outlier. Inter quartile
Chapter 2 Solutions
Statistics Through Applications
Additional Math Textbook Solutions
Basic Business Statistics, Student Value Edition
Fundamentals of Statistics (5th Edition)
Statistical Reasoning for Everyday Life (5th Edition)
Introductory Statistics
Basic Business Statistics, Student Value Edition (13th Edition)


 MATLAB: An Introduction with ApplicationsStatisticsISBN:9781119256830Author:Amos GilatPublisher:John Wiley & Sons Inc
 Probability and Statistics for Engineering and th...StatisticsISBN:9781305251809Author:Jay L. DevorePublisher:Cengage Learning
 Statistics for The Behavioral Sciences (MindTap C...StatisticsISBN:9781305504912Author:Frederick J Gravetter, Larry B. WallnauPublisher:Cengage Learning
 Elementary Statistics: Picturing the World (7th E...StatisticsISBN:9780134683416Author:Ron Larson, Betsy FarberPublisher:PEARSON
 The Basic Practice of StatisticsStatisticsISBN:9781319042578Author:David S. Moore, William I. Notz, Michael A. FlignerPublisher:W. H. Freeman
 Introduction to the Practice of StatisticsStatisticsISBN:9781319013387Author:David S. Moore, George P. McCabe, Bruce A. CraigPublisher:W. H. Freeman