
Videos
(a)
To Explain: the shape, centre and spread of the distribution
(a)
Explanation of Solution
Given:
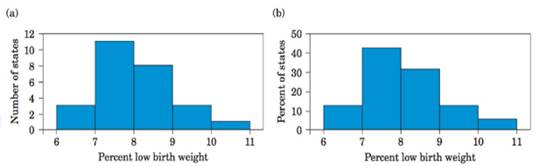
By seeing the histogram the highest bar on the left side and lowest on the right side which shows that the distribution is right skewed or positive skewed and the minimum and maximum percentages are 6% and 11% respectively so the spread of the data is between 6% and 11%. The centre lies between 7% and 8%.
(b)
To Explain: the preferable to use percents rather than counts on the vertical axis of a histogram
(b)
Explanation of Solution
Percentages are more useful if want to determine this for the normal population on the vertical axis of a histogram rather than per state because frequency distributions are shows that classify and present frequency counts so that the information can be explained more simply.
(c)
To Explain: the possible reason behind such a high percent of low-birth weight infants.
(c)
Explanation of Solution
There are many reasons behind high percent of low-birth weight infants which are possible causes are poverty, lots of obesity, infection in the mother or baby prior to birth, multiple birth (twins or more), prematurity and more teenage birth etc.
Chapter 2 Solutions
Statistics Through Applications
Additional Math Textbook Solutions
Statistics for Business and Economics (13th Edition)
Introductory Statistics
Introductory Statistics
Introductory Statistics (2nd Edition)
STATS:DATA+MODELS-W/DVD
Elementary Statistics (13th Edition)


 MATLAB: An Introduction with ApplicationsStatisticsISBN:9781119256830Author:Amos GilatPublisher:John Wiley & Sons Inc
 Probability and Statistics for Engineering and th...StatisticsISBN:9781305251809Author:Jay L. DevorePublisher:Cengage Learning
 Statistics for The Behavioral Sciences (MindTap C...StatisticsISBN:9781305504912Author:Frederick J Gravetter, Larry B. WallnauPublisher:Cengage Learning
 Elementary Statistics: Picturing the World (7th E...StatisticsISBN:9780134683416Author:Ron Larson, Betsy FarberPublisher:PEARSON
 The Basic Practice of StatisticsStatisticsISBN:9781319042578Author:David S. Moore, William I. Notz, Michael A. FlignerPublisher:W. H. Freeman
 Introduction to the Practice of StatisticsStatisticsISBN:9781319013387Author:David S. Moore, George P. McCabe, Bruce A. CraigPublisher:W. H. Freeman