
Concept explainers
Videos
(a)
To Explain: the reason that this graph is correct and explains it.
(a)
Answer to Problem 2.70RE
Yes, correct
Explanation of Solution
Given:
Passenger car sales by several manufacturers in the same year
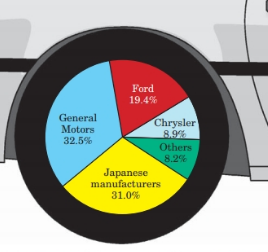
Percentage of passenger car sales by several manufacturers in the same year of ford, Chrysler, Japanese, general and others are 19.4%, 8.9%, 31%, 32.5 and 8.2% respectively by adding all the percentage which is 100% so pie chart can be made because it requires that total percentage should be 100%.
(b)
To construct: the bar graph on the basis of given data and explain the advantage of new over the pie chart.
(b)
Explanation of Solution
Graph:
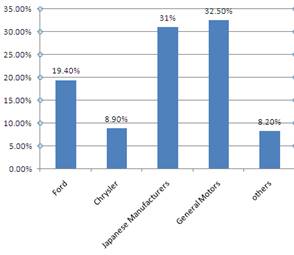
Using the data on pie chart make the bar graph which is better than pie chart because the slices of the bar graph is more bigger than pie chart this is the advantage over the pie chart which is looking forth.
Chapter 2 Solutions
Statistics Through Applications
Additional Math Textbook Solutions
A Problem Solving Approach To Mathematics For Elementary School Teachers (13th Edition)
Calculus: Early Transcendentals (2nd Edition)
Elementary Statistics: Picturing the World (7th Edition)
University Calculus: Early Transcendentals (4th Edition)
College Algebra with Modeling & Visualization (5th Edition)
Elementary Statistics (13th Edition)


 MATLAB: An Introduction with ApplicationsStatisticsISBN:9781119256830Author:Amos GilatPublisher:John Wiley & Sons Inc
 Probability and Statistics for Engineering and th...StatisticsISBN:9781305251809Author:Jay L. DevorePublisher:Cengage Learning
 Statistics for The Behavioral Sciences (MindTap C...StatisticsISBN:9781305504912Author:Frederick J Gravetter, Larry B. WallnauPublisher:Cengage Learning
 Elementary Statistics: Picturing the World (7th E...StatisticsISBN:9780134683416Author:Ron Larson, Betsy FarberPublisher:PEARSON
 The Basic Practice of StatisticsStatisticsISBN:9781319042578Author:David S. Moore, William I. Notz, Michael A. FlignerPublisher:W. H. Freeman
 Introduction to the Practice of StatisticsStatisticsISBN:9781319013387Author:David S. Moore, George P. McCabe, Bruce A. CraigPublisher:W. H. Freeman