
Concept explainers
Videos
(a)
To Explain: the graph in which shows strong seasonal variation and expect the price of fresh oranges to show seasonal variation.
(a)
Explanation of Solution
Given:
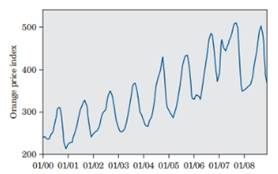
From the graph, peaks on the graph which indicates the seasonal variation and expecting the seasonal variation because after summer season there would be more fresh oranges in the market so price will be cheaper when there are low amount of fresh oranges.
(b)
To Explain: the overall trend in orange prices during the periods.
(b)
Explanation of Solution
Given:
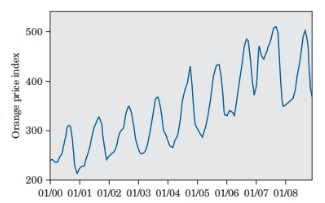
From the graph, it observed that there are lots of ups and down which shows the increase of price of orange. If not considering the seasonally period the most of the trend is increase in the prices of oranges.
Chapter 2 Solutions
Statistics Through Applications
Additional Math Textbook Solutions
Introductory Statistics (2nd Edition)
Statistical Reasoning for Everyday Life (5th Edition)
Basic Business Statistics, Student Value Edition (13th Edition)
Fundamentals of Statistics (5th Edition)
Elementary Statistics: Picturing the World (7th Edition)


 MATLAB: An Introduction with ApplicationsStatisticsISBN:9781119256830Author:Amos GilatPublisher:John Wiley & Sons Inc
 Probability and Statistics for Engineering and th...StatisticsISBN:9781305251809Author:Jay L. DevorePublisher:Cengage Learning
 Statistics for The Behavioral Sciences (MindTap C...StatisticsISBN:9781305504912Author:Frederick J Gravetter, Larry B. WallnauPublisher:Cengage Learning
 Elementary Statistics: Picturing the World (7th E...StatisticsISBN:9780134683416Author:Ron Larson, Betsy FarberPublisher:PEARSON
 The Basic Practice of StatisticsStatisticsISBN:9781319042578Author:David S. Moore, William I. Notz, Michael A. FlignerPublisher:W. H. Freeman
 Introduction to the Practice of StatisticsStatisticsISBN:9781319013387Author:David S. Moore, George P. McCabe, Bruce A. CraigPublisher:W. H. Freeman