
Concept explainers
Videos
(a)
To Explain: the reason of misleading of the given graph.
(a)
Explanation of Solution
Given:

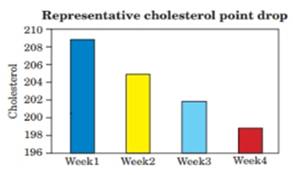
By seeing the given graph, it is observed that it is misleading because on y axis in the graph that it is start from the 196 cholesterol which is not corresponds to 0 that is the reason which will goes to mislead.
(b)
To construct: the new graph which is not misleading and concludes about the effect of eating Quaker Oats on cholesterol reduction.
(b)
Explanation of Solution
Given:
Figure 1
Graph:
Figure 2
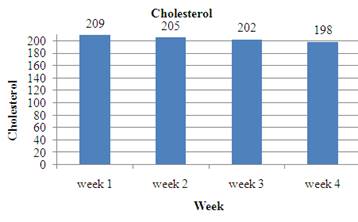
By seeing the given graph figure number 1, it is observed that it is misleading because on y axis in the graph figure number 1 it is start from 196 cholesterol So drawing new graph on the basis of given data which is in figure 2 which in not misleading because it is start from 0.
Chapter 2 Solutions
Statistics Through Applications
Additional Math Textbook Solutions
Intro Stats, Books a la Carte Edition (5th Edition)
Elementary Statistics Using Excel (6th Edition)
Elementary Statistics: Picturing the World (7th Edition)
STATS:DATA+MODELS-W/DVD
Introductory Statistics (2nd Edition)
Basic Business Statistics, Student Value Edition


 MATLAB: An Introduction with ApplicationsStatisticsISBN:9781119256830Author:Amos GilatPublisher:John Wiley & Sons Inc
 Probability and Statistics for Engineering and th...StatisticsISBN:9781305251809Author:Jay L. DevorePublisher:Cengage Learning
 Statistics for The Behavioral Sciences (MindTap C...StatisticsISBN:9781305504912Author:Frederick J Gravetter, Larry B. WallnauPublisher:Cengage Learning
 Elementary Statistics: Picturing the World (7th E...StatisticsISBN:9780134683416Author:Ron Larson, Betsy FarberPublisher:PEARSON
 The Basic Practice of StatisticsStatisticsISBN:9781319042578Author:David S. Moore, William I. Notz, Michael A. FlignerPublisher:W. H. Freeman
 Introduction to the Practice of StatisticsStatisticsISBN:9781319013387Author:David S. Moore, George P. McCabe, Bruce A. CraigPublisher:W. H. Freeman