
Videos
(a)
To construct: the dot plot on the basis of given data.
(a)
Explanation of Solution
Given:
| 5 | 0 | 1 | 0 | 7 | 2 | 1 | 0 | 4 | 0 | 3 | 0 | 2 | 0 |
| 3 | 1 | 5 | 0 | 3 | 0 | 1 | 0 | 1 | 0 | 2 | 0 | 3 | 1 |
Graph:
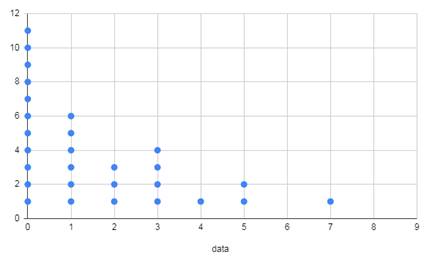
By seeing the dot plot it is clearly show that it is right skewed because highest dot on the left side and the
(b)
To Explain: the distribution of the variable and shape, centre and spread.
(b)
Explanation of Solution
By seeing the dot plot, most of the data points are on the left side and little dot plots on the right side so the distribution is right skewed. Maximum dot plots on 0 so mode is 0. The center lies at 1 and the minimum and maximum values are 0 and 7 respectively so the data spread between 0 and 7. Inter
Chapter 2 Solutions
Statistics Through Applications
Additional Math Textbook Solutions
University Calculus: Early Transcendentals (4th Edition)
Basic Business Statistics, Student Value Edition
Elementary Statistics
Thinking Mathematically (6th Edition)
Precalculus
Calculus: Early Transcendentals (2nd Edition)


- Sketch to scale the orbit of Earth about the sun. Graph Icarus’ orbit on the same set of axesWhile the sun is the center of Earth’s orbit, it is a focus of Icarus’ orbit. There aretwo points of intersection on the graph. Based on the graph, what is the approximate distance between the two points of intersection (in AU)?arrow_forwardThe diameters of ball bearings are distributed normally. The mean diameter is 67 millimeters and the standard deviation is 3 millimeters. Find the probability that the diameter of a selected bearing is greater than 63 millimeters. Round to four decimal places.arrow_forwardSuppose you like to keep a jar of change on your desk. Currently, the jar contains the following: 22 Pennies 27 Dimes 9 Nickels 30 Quarters What is the probability that you reach into the jar and randomly grab a penny and then, without replacement, a dime? Express as a fraction or a decimal number rounded to four decimal places.arrow_forward
- A box contains 14 large marbles and 10 small marbles. Each marble is either green or white. 9 of the large marbles are green, and 4 of the small marbles are white. If a marble is randomly selected from the box, what is the probability that it is small or white? Express as a fraction or a decimal number rounded to four decimal places.arrow_forwardCan I get help with this step please? At a shooting range, instructors can determine if a shooter is consistently missing the target because of the gun sight or because of the shooter's ability. If a gun's sight is off, the variance of the distances between the shots and the center of the shot pattern will be small (even if the shots are not in the center of the target). A student claims that it is the sight that is off, not his aim, and wants the instructor to confirm his claim. If a skilled shooter fires a gun at a target multiple times, the distances between the shots and the center of the shot pattern, measured in centimeters (cm), will have a variance of less than 0.33. After the student shoots 28 shots at the target, the instructor calculates that the distances between his shots and the center of the shot pattern, measured in cm, have a variance of 0.25. Does this evidence support the student's claim that the gun's sight is off? Use a 0.025 level of significance. Assume that the…arrow_forwardThe National Academy of Science reported that 38% of research in mathematics is published by US authors. The mathematics chairperson of a prestigious university wishes to test the claim that this percentage is no longer 38%. He has no indication of whether the percentage has increased or decreased since that time. He surveys a simple random sample of 279 recent articles published by reputable mathematics research journals and finds that 123 of these articles have US authors. Does this evidence support the mathematics chairperson's claim that the percentage is no longer 38 % ? Use a 0.02 level of significance. Compute the value of the test statistic. Round to two decimal places.arrow_forward
- A marketing research company desires to know the mean consumption of milk per week among males over age 32. They believe that the milk consumption has a mean of 4 liters, and want to construct a 98% confidence interval with a maximum error of 0.07 liters. Assuming a variance of 0.64 liters, what is the minimum number of males over age 32 they must include in their sample? Round up to the next integer.arrow_forwardSuppose GRE Verbal scores are normally distributed with a mean of 461 and a standard deviation of 118. A university plans to recruit students whose scores are in the top 4 % . What is the minimum score required for recruitment? Round to the nearest whole number, if necessaryarrow_forwardNeed help with my homework thank you random sample of 6 fields of durum wheat has a mean yield of 45.5 bushels per acre and standard deviation of 7.43 bushels per acre. Determine the 80 % confidence interval for the true mean yield. Assume the population is approximately normal. Step 1: Find the critical value that should be used in constructing the confidence interval. Round to three decimal places. Step 2 of 2: Construct the 80% confidence interval. Round to one decimal place. I got 1.476 as my critical value and 41.0 and 49.9 as my confidence intervalarrow_forward
- Can someone check my work? If you draw a card with a value of four or less from a standard deck of cards, I will pay you $14. If not, you pay me $8. (Aces are considered the highest card in the deck.) Step 1 of 2: Find the expected value of the proposition. Round to two decimal places. Losses must be expressed as negative values. PT 2: If you played this game 718 times how much would you expect to win or lose? Round your answer to two decimal places. Losses must be expressed as negative values. for part 1 I got -2.92 pt 2 -2097.56arrow_forwardThe following table describes the distribution of a random sample S of 200 individuals, arranged by education level and income. Income(Dollars per Year) < High School High School Diploma Some College Bachelor’s Degree Graduate Degree Post-Graduate Degree 0-25,000 12 8 3 2 1 0 25,000-50,000 7 12 9 12 11 2 50,000-75,000 1 3 4 6 14 5 75,000-100,000 0 2 1 8 11 8 100,000-125,000 0 1 1 4 8 9 125,000-150,000 0 0 2 3 7 12 150,000+ 0 0 1 1 3 6 Let events be defined as follows: A = the event the subject makes 0-25,000 dollars per yearB = the event the subject makes 25,000-50,000 dollars per year C = the event the subject makes 50,000-75,000 dollars per yearD = the event the subject makes 75,000-100,000 dollars per yearE = the event the subject makes 100,000-125,000 dollars per yearF = the event the subject makes 125,000-150,000 dollars per yearG = the event…arrow_forwardwhat does the central limit theorem, for all samples of the same size n with n>30, the sampling distribution of x can be approximated by a normal distribution mean? What is a real life example using this theoremarrow_forward
 MATLAB: An Introduction with ApplicationsStatisticsISBN:9781119256830Author:Amos GilatPublisher:John Wiley & Sons Inc
 Probability and Statistics for Engineering and th...StatisticsISBN:9781305251809Author:Jay L. DevorePublisher:Cengage Learning
 Statistics for The Behavioral Sciences (MindTap C...StatisticsISBN:9781305504912Author:Frederick J Gravetter, Larry B. WallnauPublisher:Cengage Learning
 Elementary Statistics: Picturing the World (7th E...StatisticsISBN:9780134683416Author:Ron Larson, Betsy FarberPublisher:PEARSON
 The Basic Practice of StatisticsStatisticsISBN:9781319042578Author:David S. Moore, William I. Notz, Michael A. FlignerPublisher:W. H. Freeman
 Introduction to the Practice of StatisticsStatisticsISBN:9781319013387Author:David S. Moore, George P. McCabe, Bruce A. CraigPublisher:W. H. Freeman