
Concept explainers
Videos
(a)
To find: the highest percent of residents aged 25 to 34 and reason for an unusually high percent of residents in this age group.
(a)
Answer to Problem 2.11E
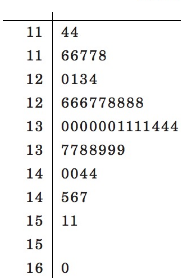
16.0%
Explanation of Solution
Given:

By seeing the stem plot it is observed that 16.0% is the highest percentage and therefore this would be percent of the researcher, mainly because of immigration.
(b)
To Explain: the shape, centre and spread of the distribution, ignoring the researcher.
(b)
Explanation of Solution
Given:

By seeing the stem plot, it is observed that centre is at 13.0% and the minimum and maximum percentages are 11.4% and 16.0% so the spread is between 11.4% and 16.0%. It is also observed that the data is approximately symmetric.
(c)
To Explain: that the distribution for young adults more or less spread out than the distribution in the figure for older adults, justify the answer.
(c)
Explanation of Solution
Given:
It seem less because the spread of data was between 7.0% and 17.0% and lower value is lower than the lower certain value in (b) and upper value is higher than the upper certain value in (b).
Chapter 2 Solutions
Statistics Through Applications
Additional Math Textbook Solutions
Basic Business Statistics, Student Value Edition (13th Edition)
Elementary Statistics Using Excel (6th Edition)
Statistics: The Art and Science of Learning from Data (4th Edition)
Elementary Statistics
Fundamentals of Statistics (5th Edition)


 MATLAB: An Introduction with ApplicationsStatisticsISBN:9781119256830Author:Amos GilatPublisher:John Wiley & Sons Inc
 Probability and Statistics for Engineering and th...StatisticsISBN:9781305251809Author:Jay L. DevorePublisher:Cengage Learning
 Statistics for The Behavioral Sciences (MindTap C...StatisticsISBN:9781305504912Author:Frederick J Gravetter, Larry B. WallnauPublisher:Cengage Learning
 Elementary Statistics: Picturing the World (7th E...StatisticsISBN:9780134683416Author:Ron Larson, Betsy FarberPublisher:PEARSON
 The Basic Practice of StatisticsStatisticsISBN:9781319042578Author:David S. Moore, William I. Notz, Michael A. FlignerPublisher:W. H. Freeman
 Introduction to the Practice of StatisticsStatisticsISBN:9781319013387Author:David S. Moore, George P. McCabe, Bruce A. CraigPublisher:W. H. Freeman