
Statistics Through Applications
2nd Edition
ISBN: 9781429219747
Author: Daren S. Starnes, David Moore, Dan Yates
Publisher: Macmillan Higher Education
expand_more
expand_more
format_list_bulleted
Concept explainers
Videos
Question
Chapter 2, Problem 2.74RE
To determine
To construct: the comparative box plot for both and explain it.
Expert Solution & Answer
Explanation of Solution
Given:
Bonds
16 25 24 19 33 25 34 46 37 33 42 40 37 34 49 73
McGwire
49 32 33 39 22 42 39 52 58 70
Graph:
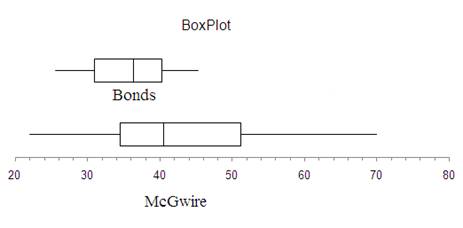
By comparing the both the box plots it seem that second box plot is the better home run hitter because his mean and
Chapter 2 Solutions
Statistics Through Applications
Ch. 2.1 - Prob. 2.1ECh. 2.1 - Prob. 2.2ECh. 2.1 - Prob. 2.3ECh. 2.1 - Prob. 2.4ECh. 2.1 - Prob. 2.5ECh. 2.1 - Prob. 2.6ECh. 2.1 - Prob. 2.7ECh. 2.1 - Prob. 2.8ECh. 2.1 - Prob. 2.9ECh. 2.1 - Prob. 2.10E
Ch. 2.1 - Prob. 2.11ECh. 2.1 - Prob. 2.12ECh. 2.1 - Prob. 2.13ECh. 2.1 - Prob. 2.14ECh. 2.1 - Prob. 2.15ECh. 2.1 - Prob. 2.16ECh. 2.1 - Prob. 2.17ECh. 2.1 - Prob. 2.19ECh. 2.1 - Prob. 2.20ECh. 2.1 - Prob. 2.21ECh. 2.1 - Prob. 2.23ECh. 2.1 - Prob. 2.24ECh. 2.1 - Prob. 2.25ECh. 2.1 - Prob. 2.26ECh. 2.2 - Prob. 2.27ECh. 2.2 - Prob. 2.28ECh. 2.2 - Prob. 2.29ECh. 2.2 - Prob. 2.30ECh. 2.2 - Prob. 2.31ECh. 2.2 - Prob. 2.32ECh. 2.2 - Prob. 2.33ECh. 2.2 - Prob. 2.34ECh. 2.2 - Prob. 2.35ECh. 2.2 - Prob. 2.36ECh. 2.2 - Prob. 2.37ECh. 2.2 - Prob. 2.38ECh. 2.2 - Prob. 2.39ECh. 2.2 - Prob. 2.40ECh. 2.2 - Prob. 2.41ECh. 2.2 - Prob. 2.42ECh. 2.2 - Prob. 2.43ECh. 2.2 - Prob. 2.44ECh. 2.2 - Prob. 2.45ECh. 2.2 - Prob. 2.46ECh. 2.2 - Prob. 2.47ECh. 2.2 - Prob. 2.48ECh. 2.2 - Prob. 2.49ECh. 2.2 - Prob. 2.50ECh. 2.2 - Prob. 2.51ECh. 2.2 - Prob. 2.52ECh. 2.3 - Prob. 2.53ECh. 2.3 - Prob. 2.54ECh. 2.3 - Prob. 2.55ECh. 2.3 - Prob. 2.56ECh. 2.3 - Prob. 2.57ECh. 2.3 - Prob. 2.58ECh. 2.3 - Prob. 2.59ECh. 2.3 - Prob. 2.60ECh. 2.3 - Prob. 2.61ECh. 2.3 - Prob. 2.62ECh. 2.3 - Prob. 2.63ECh. 2.3 - Prob. 2.64ECh. 2.3 - Prob. 2.65ECh. 2 - Prob. 2.67RECh. 2 - Prob. 2.68RECh. 2 - Prob. 2.69RECh. 2 - Prob. 2.70RECh. 2 - Prob. 2.71RECh. 2 - Prob. 2.72RECh. 2 - Prob. 2.73RECh. 2 - Prob. 2.74RECh. 2 - Prob. 2.75RECh. 2 - Prob. 2.76RE
Additional Math Textbook Solutions
Find more solutions based on key concepts
The relative frequencies distribution for the ranks for faculty.
Introductory Statistics (10th Edition)
Explain the meaning of the term “statistically significant difference” in statistics terminology.
Intro Stats, Books a la Carte Edition (5th Edition)
Using Normal Approximation. In Exercises 5–8, do the following: If the requirements of np ? 5 and nq ? 5 are bo...
Essentials of Statistics (6th Edition)
Of versus More Than. Explain the difference between the key words of and more than when dealing with percentage...
Statistical Reasoning for Everyday Life (5th Edition)
11.92 Ranking driving performance of professional golfers. Refer to The Sport Journal (Winter 2007) study of a ...
Statistics for Business and Economics (13th Edition)
Knowledge Booster


Learn more about
Need a deep-dive on the concept behind this application? Look no further. Learn more about this topic, statistics and related others by exploring similar questions and additional content below.Recommended textbooks for you
 MATLAB: An Introduction with ApplicationsStatisticsISBN:9781119256830Author:Amos GilatPublisher:John Wiley & Sons Inc
 Probability and Statistics for Engineering and th...StatisticsISBN:9781305251809Author:Jay L. DevorePublisher:Cengage Learning
 Statistics for The Behavioral Sciences (MindTap C...StatisticsISBN:9781305504912Author:Frederick J Gravetter, Larry B. WallnauPublisher:Cengage Learning
 Elementary Statistics: Picturing the World (7th E...StatisticsISBN:9780134683416Author:Ron Larson, Betsy FarberPublisher:PEARSON
 The Basic Practice of StatisticsStatisticsISBN:9781319042578Author:David S. Moore, William I. Notz, Michael A. FlignerPublisher:W. H. Freeman
 Introduction to the Practice of StatisticsStatisticsISBN:9781319013387Author:David S. Moore, George P. McCabe, Bruce A. CraigPublisher:W. H. Freeman
MATLAB: An Introduction with Applications
Statistics
ISBN:9781119256830
Author:Amos Gilat
Publisher:John Wiley & Sons Inc
Probability and Statistics for Engineering and th...
Statistics
ISBN:9781305251809
Author:Jay L. Devore
Publisher:Cengage Learning
Statistics for The Behavioral Sciences (MindTap C...
Statistics
ISBN:9781305504912
Author:Frederick J Gravetter, Larry B. Wallnau
Publisher:Cengage Learning
Elementary Statistics: Picturing the World (7th E...
Statistics
ISBN:9780134683416
Author:Ron Larson, Betsy Farber
Publisher:PEARSON
The Basic Practice of Statistics
Statistics
ISBN:9781319042578
Author:David S. Moore, William I. Notz, Michael A. Fligner
Publisher:W. H. Freeman
Introduction to the Practice of Statistics
Statistics
ISBN:9781319013387
Author:David S. Moore, George P. McCabe, Bruce A. Craig
Publisher:W. H. Freeman
The Shape of Data: Distributions: Crash Course Statistics #7; Author: CrashCourse;https://www.youtube.com/watch?v=bPFNxD3Yg6U;License: Standard YouTube License, CC-BY
Shape, Center, and Spread - Module 20.2 (Part 1); Author: Mrmathblog;https://www.youtube.com/watch?v=COaid7O_Gag;License: Standard YouTube License, CC-BY
Shape, Center and Spread; Author: Emily Murdock;https://www.youtube.com/watch?v=_YyW0DSCzpM;License: Standard Youtube License