
Videos
(a)
To Calculate: the
(a)
Answer to Problem 2.40E
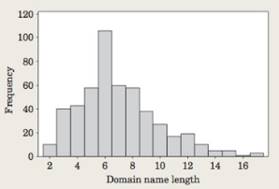
Median and mean are 6 and 8 respectively.
Explanation of Solution
Given:

The distribution is left-skewed or negative skewed so median would be lying to the left of the mean. The data have 500 numbers; the median would be at the 250th number so median will be 6. Observing that the minimum and maximum data values are 2 and 16 respectively so spread of the data between 2 and 16. The mean will lie about in the mid way therefore the mean is about 8
I
(b)
To Explain: that which measure of centre mean or the median, explain it.
(b)
Answer to Problem 2.40E
Median
Explanation of Solution
Given:
Median, because by seeing the histogram median can be get very quickly then mean because for getting the mean its required lots of calculation and it take too much time. That is the median is more popular then mean.
Chapter 2 Solutions
Statistics Through Applications
Additional Math Textbook Solutions
Essentials of Statistics (6th Edition)
Statistics for Psychology
Elementary Statistics: Picturing the World (6th Edition)
Fundamentals of Statistics (5th Edition)
Intro Stats
Statistics for Business and Economics (13th Edition)


 MATLAB: An Introduction with ApplicationsStatisticsISBN:9781119256830Author:Amos GilatPublisher:John Wiley & Sons Inc
 Probability and Statistics for Engineering and th...StatisticsISBN:9781305251809Author:Jay L. DevorePublisher:Cengage Learning
 Statistics for The Behavioral Sciences (MindTap C...StatisticsISBN:9781305504912Author:Frederick J Gravetter, Larry B. WallnauPublisher:Cengage Learning
 Elementary Statistics: Picturing the World (7th E...StatisticsISBN:9780134683416Author:Ron Larson, Betsy FarberPublisher:PEARSON
 The Basic Practice of StatisticsStatisticsISBN:9781319042578Author:David S. Moore, William I. Notz, Michael A. FlignerPublisher:W. H. Freeman
 Introduction to the Practice of StatisticsStatisticsISBN:9781319013387Author:David S. Moore, George P. McCabe, Bruce A. CraigPublisher:W. H. Freeman