
Concept explainers
Videos
(a)
To construct: the stem plot on the basis of given data
(a)
Explanation of Solution
Given:

Graph:
Stem plot on the basis of given data
Stem unit =1 and leaf unit =0.1
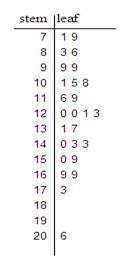
This distribution’s most of the data points are centred, at about 12.05 centre lies. There is one high outlier that is about 20.6 and the distribution is right skewed.
(b)
To Explain: the overall pattern of the stem plot
(b)
Explanation of Solution
This distribution’s most of the data points are centred, at 12.05 centre lies and 1st
Chapter 2 Solutions
Statistics Through Applications
Additional Math Textbook Solutions
Statistics for Business and Economics (13th Edition)
Introductory Statistics (2nd Edition)
Essentials of Statistics (6th Edition)
Introductory Statistics
STATS:DATA+MODELS-W/DVD
Basic Business Statistics, Student Value Edition


 MATLAB: An Introduction with ApplicationsStatisticsISBN:9781119256830Author:Amos GilatPublisher:John Wiley & Sons Inc
 Probability and Statistics for Engineering and th...StatisticsISBN:9781305251809Author:Jay L. DevorePublisher:Cengage Learning
 Statistics for The Behavioral Sciences (MindTap C...StatisticsISBN:9781305504912Author:Frederick J Gravetter, Larry B. WallnauPublisher:Cengage Learning
 Elementary Statistics: Picturing the World (7th E...StatisticsISBN:9780134683416Author:Ron Larson, Betsy FarberPublisher:PEARSON
 The Basic Practice of StatisticsStatisticsISBN:9781319042578Author:David S. Moore, William I. Notz, Michael A. FlignerPublisher:W. H. Freeman
 Introduction to the Practice of StatisticsStatisticsISBN:9781319013387Author:David S. Moore, George P. McCabe, Bruce A. CraigPublisher:W. H. Freeman