What is Central Tendency in Statistics?
It is a descriptive summary of a data set. It can be defined by using some of the measures. The central tendencies do not provide information regarding individual data from the dataset. However, they give a summary of the data set. The central tendency or measure of central tendency is a central or typical value for a probability distribution.
The central tendency is known as the statistical measure. This statistical measure represents the single value of the data set or entire distribution. The objective of evaluating a central tendency is to provide an accurate description of the entire data in the distribution.
The measure or outcome of the central tendency is a single value. It attempts to explain a set of data by identifying the central position within that set of data. The numerical expressions which represent the characteristics of a group (a large collection of numerical data) are called measures of central tendency. They are also described as measures of central location.
The measures of central tendency are mean, median, and mode. However, in different conditions, some measures of central tendency become more appropriate to use than others.
Mean (Arithmetic)
The most widely known and well-accepted measure of tendency is the mean or average. It is mostly used with continuous data. The mean represents the average value of a dataset. It can be calculated as the quotient of the sum of all the values in the data set by the number of values in the data set. The mean is usually denoted as (pronounced “x-bar”).
Example:
If there are n observations in a data set and they have values , then the mean is equal to:
The formula is also written as:
Where is Greek capital letter, which means “sum of…” and is pronounced as “sigma”.
A very significant characteristic of the mean is that it involves every value in the set of data as part of the calculation. Additionally, the mean is the lone measure of central tendency where the sum of the deviations of each value calculated from the mean is always zero.
When Not to Use the Mean?
The mean is principally susceptible to the influence of outliers, which could be considered as its one main disadvantage. There are observations that are unusual when compared to the rest of the set of data by being particularly small or large in numerical value. For example, consider the salary of staff at an organization below:
| Employee | Salary ($) |
| 1 | 13000 |
| 2 | 17000 |
| 3 | 15000 |
| 4 | 17500 |
| 5 | 15000 |
| 6 | 12000 |
| 7 | 18500 |
| 8 | 15500 |
| 9 | 86000 |
| 10 | 93000 |
The mean salary for ten employees is $30,250. However, the data set suggests that this mean value might not be the best way to accurately reflect the typical salary of an employee, as most employees have salaries in the $12000 to $18500 range. The mean is being altered by the two hefty salaries. Therefore, in this situation, there is a need to use other better measures of central tendency instead of mean.
Median
The middle value of a data set is called the median of the data. The median divides the data set into two halves and is called the 50th percentile. The median is much less affected by outliers and skewed data than the mean. If the number of elements in a dataset is odd, then the middlemost element of the data arranged in ascending or descending order is the median. If the number of elements in a data set is even, the average of the two central elements of the arranged data is the median of the set.
Median with Even Data Set
When the dataset contains an even number of values, then the median value of the dataset can be found by taking the mean of the middle two values. Let’s use the same example of salary of 10 employees and after arranging data in ascending order –
| Salary ($) |
| 12000 |
| 13000 |
| 15000 |
| 15000 |
| 15500 |
| 17000 |
| 17500 |
| 18500 |
| 86000 |
| 93000 |
Two middle values (5th and 6th) are 15500 and 17000 and average of it will give the median value i.e. 16250.
Median with Odd Data Set
When the dataset contains an odd number of values, then the middle value of the data set will be the median value. As per the below table, after arranging data in ascending order –
| Salary ($) |
| 12000 |
| 13000 |
| 15000 |
| 15000 |
| 15500 |
| 17500 |
| 18500 |
| 86000 |
| 93000 |
The middle value (5thvalue) is 15500 is the median value of the data set.
Mode
The value that occurs most frequently in a data set is called the mode of the data. If no two categories in the given data are the same, then the dataset has no mode. A dataset may have more than one mode if multiple categories repeat an equal number of times. The mode is the only measure of central tendency that is used for categorical variables.
Consider the given dataset 5, 4, 2, 3, 2, 1, 5, 4, 5
| Mode |
| 5 |
| 5 |
| 5 |
| 4 |
| 4 |
| 3 |
| 2 |
| 2 |
| 1 |
Since the mode represents the most common value. Therefore, the most recurrently occurring value in the given data set is 5.
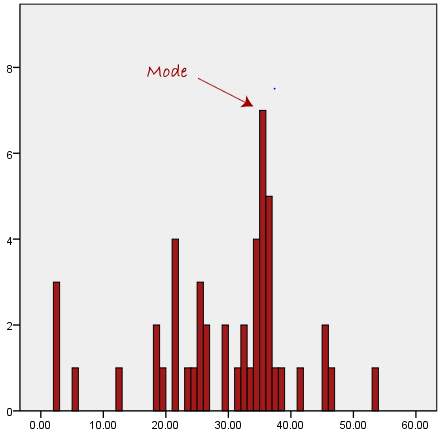
On a histogram or bar chart, the element with the highest bar represents the mode. Therefore, the mode is sometimes considered the most popular option.
Consider the example given below:
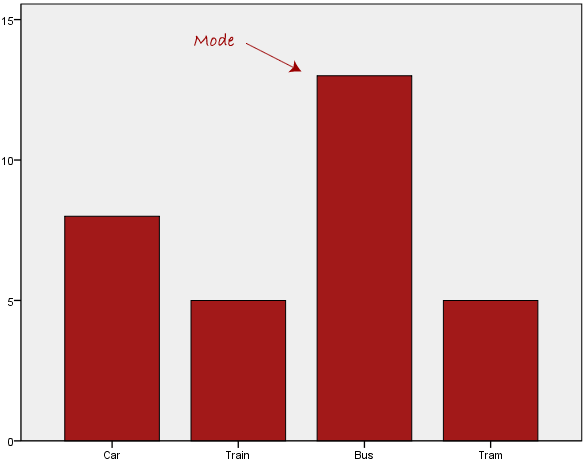
In this particular data set, the preferred mode of transport is the bus.
Why is Mode Rarely used with Continuous data?
The mode is particularly problematic with continuous data because it is more likely not to have any value that is more frequent than the other.
For example, consider the data set consisting of the weights of 30 people. How likely is it that that two or more people with exactly the same weight (e.g., 55.4 kg) are present in the same sample? The answer would be that it is perhaps highly unlikely. Though many people might be close, it is impossible to find two people with exactly the same weight (to the nearest 0.1 kg), with such a small sample (30 people) and a large range of possible weights. This is why the mode is very rarely used with continuous data.
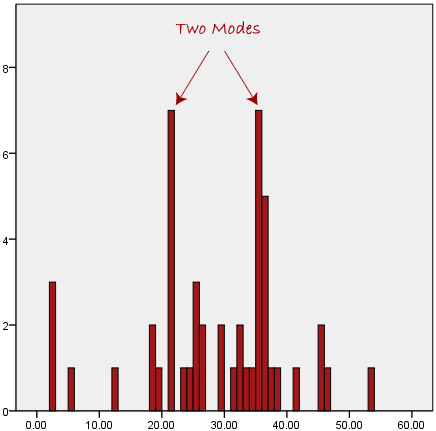
Other Limitations of Using Mode
One of the major limitations with the mode is that it is not unique. So it leaves with problems when having two or more values that share the highest frequency, such as below:
Summary of When to Use Mean, Median and Mode
The below table will help to choose the best measures of central tendency with respect to different types of variables.
| Type of Variable | The Best Measure of Central Tendency |
| Nominal | Mode |
| Ordinal | Median |
| Interval/Ratio (not skewed) | Mean |
| Interval/Ratio (skewed) | Median |
Formula
Arithmetic mean:
Context and Applications
- Measures of central tendency are useful for:
- School and college-level education
- Post-graduation course in mathematics
- Data analysis courses
- Engineering courses
Want more help with your statistics homework?
*Response times may vary by subject and question complexity. Median response time is 34 minutes for paid subscribers and may be longer for promotional offers.
Search. Solve. Succeed!
Study smarter access to millions of step-by step textbook solutions, our Q&A library, and AI powered Math Solver. Plus, you get 30 questions to ask an expert each month.
Mean, Median, Mode Homework Questions from Fellow Students
Browse our recently answered Mean, Median, Mode homework questions.
Search. Solve. Succeed!
Study smarter access to millions of step-by step textbook solutions, our Q&A library, and AI powered Math Solver. Plus, you get 30 questions to ask an expert each month.