Concept explainers
Videos
Starting with an F- strain that was prototrophic (that is, had no auxotrophic mutations) and Strs, several independent Hfr strains were isolated. These Hfr strains were mated to an F- strain that was Strr Arg- Cys- His- Ilv- Lys- Met- Nic- Pab- Pyr- Trp-. Interrupted-mating experiments showed that the Hfr strains transferred the wild-type alleles in the order listed in the following table as a function of time. The time of entry for the markers within parentheses could not be distinguished from one another.
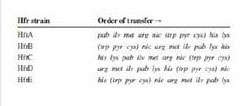
| a. | From these data, derive a map of the relative position of these markers on the bacterial chromosome. Indicate with labeled arrows the position and orientation of the integrated F plasmid for each Hfr strain. |
| b. | To determine the relative order of the trp, pyr, and cys markers and the distances between them, HfrB was mated with the F- strain long enough to allow transfer of the nic marker, after which Trp+ recombinants were selected. The unselected markers pyr and cys were then scored in the Trp+ recombinants were selected. The unselected markers pyr and cys were then scored in the Trp+ recombinants, yielding the following results: |
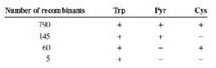
Draw a map of the trp, pyr, and cys markers relative to each other. (Note that you cannot determine the order relative to the nic or his genes using these data.) Express map distances between adjacent genes as the frequency of crossing-over between them.
Want to see the full answer?
Check out a sample textbook solution
Chapter 14 Solutions
Genetics: From Genes to Genomes


- Bacteriophage P22 was used in generalised transduction experiments to infect the Salmonella typhimurium donor strains described in the table below. The resulting phage lysates were then used to infect the recipient strains of S. typhimurium recipient strains listed in the table. In each cross, a phenotype was selected for one of the selected for one of the three genetic markers studied (str, aceA, thrA), and were made to select the recombinants corresponding to the other two markers. markers. The results are given in the following table: Strain I donor str thrA aceA thrA str aceA+ Strain recipient strs thrA+ aceA thrA str aceA Phenotype selected Str Ace+ Str recombinants selected ThrA ThrA ThrA ThrA Ace Ace Number 60 40 95 5 10 90 str: gene involved in streptomycin resistance, aceA: gene involved in the use of acetate as a carbon source, thrA: gene involved in threonine biosynthesis. 1) What are the selective media used in these three transduction experiments? to obtain the selected…arrow_forwardAustin Taylor and Edward Adelberg isolated some new strains of Hfr cells that they then used to map several 200 mal+ genes in Escherichia coli by using interrupted conjugation. 150 In one experiment, the researchers mixed cells of Hfr strain AB-312, which were xyl* mtl* mal* met* and sensitive to phage T6, with F strain AB-531, which was xyl mtl mal met and resistant to phage T6. The 100 mt/+ cells were allowed to undergo conjugation. At regular intervals, the researchers removed a sample of cells and 50 met+ interrupted conjugation by killing the Hfr cells with phage T6. The F cells, which were resistant to phage T6, survived and were then tested for the presence of 0. 20 40 60 80 100 genes transferred from the Hfr strain. The results of this experiment are shown in the graph. Time of sampling (minutes) On the basis of these data, give the order of the xyl, mtl, mal, and met genes on the bacterial chromosome and the minimum distances between them in minutes. The origin of transfer is…arrow_forwardIn five Hfr strains, each of which was used to build a time-of-transfer map, the genes entered the recipient cells as follows: Strain 1: S L A C T F Strain 2: N P F T C A Strain 3: T F P N U Y Strain 4: S H Y U N P Strain 5: U N P F T C Which of the following represents a correct gene map of these results? N P F T S L A C H U Y S L A C T F P N H Y U C T F P N U Y H S L A T C A L S P N U Y H F U N P C A L S F T H Yarrow_forward
- A prototrophic strain (his" arg" lac') was used as a donor to transform an auxotrophic strain (his arg lac'). Initial transformants are isolated on minimal medium + histidine + arginine + lactose - glucose. i. What genotypes will grow on this medium? ii. These colonies are replicated to minimal medium + histidine, and 50% of the original colonies grow. What genotypes will grow on this medium? iii. The original colonies are also replicated to minimal medium + arginine, and 10% of the colonies grow. What genotypes will grow on this medium? iv. The original colonies are also replicated to minimal medium. No colonies grow. Based on this information, what genotypes will grow on minimal medium + histidine and on minimal medium + arginine? What is the relative gene order for his, arg, and lac? Which two genes are closer? Explain your answer.arrow_forwardIn E. coli, the gene bioD+ encodes an enzyme involved in biotin synthesis, and galK+ encodes an enzyme involved in galactose utilization. An E. coli strain that contained wild-type versions of both genes was infected with P1 phage, and then a P1 lysate was obtained. This lysate was used totransduce (infect) a strain that was bioD− and galK−. The cellswere plated on a medium containing galactose as the sole carbonsource for growth to select for transduction of the galK+ gene.This medium also was supplemented with biotin. The resultingcolonies were then restreaked on a medium that lacked biotin tosee if the bioD+ gene had been cotransduced. The following resultswere obtained:What topic in genetics does this question address?arrow_forwardIn E. coli, the gene bioD+ encodes an enzyme involved in biotin synthesis, and galK+ encodes an enzyme involved in galactose utilization. An E. coli strain that contained wild-type versions of both genes was infected with P1 phage, and then a P1 lysate was obtained. This lysate was used totransduce (infect) a strain that was bioD− and galK−. The cellswere plated on a medium containing galactose as the sole carbonsource for growth to select for transduction of the galK+ gene.This medium also was supplemented with biotin. The resultingcolonies were then restreaked on a medium that lacked biotin tosee if the bioD+ gene had been cotransduced. The following resultswere obtained:What information do you know based onthe question and your understanding of the topic?arrow_forward
- Bacteriophage P22 was used in generalized transduction experiments to infect the Salmonella typhimurium donor strains described in the table below. The resulting phage lysates were then used to infect the S. typhimurium recipient strains listed in the table. In each cross, a phenotype was selected for one of the three genetic markers studied (str, aceA, thrA), and then replicates were performed to select the corresponding recombinants for the other two markers. The results are given in the following table: Recipient strain Selected phenotype Selected recombinants Donor strain str thrA aceA+ thrA str aceA+ strs thrA+ aceA thrA+ str aceA Str Ace+ Str ThrA ThrA+ ThrA ThrA+ Ace Ace str: gene involved in streptomycin resistance, aceA gene involved in the use of acetate as a carbon source, thrA: gene involved in the biosynthesis of threonine. Number 60 40 95 5 10 90 Determine the order of the genes and draw a genetic map showing this orderarrow_forwardA donor strain of bacteria with genotype leu* gal pro* is infected with phages. The phage lysate from the bacterial cells is collected and used to infect a second strain of bacteria that are leu gal* pro". The second strain is selected for leu", and the following cotransduction data are obtained: Cells with cotransduced allele (%) Selected Donor Recipient allele leu* leu" gal* leu* 47 pro* gal" pro* pro leu* 26 gal" Which genes are closest, leu and gal or leu and pro?arrow_forwardAustin Taylor and Edward Adelberg isolated some new strains of Hfr cells that they then used to map several genes in E. coli by using interrupted conjugation . In one experiment, they mixed cells of Hfr strain AB-312, which were xyl+ mtl+ mal+ met+ and sensitive to phage T6, with F− strain AB-531, which was xyl− mtl− mal− met− and resistant to phage T6. The cells were allowed to undergo conjugation. At regular intervals, the researchers removed a sample of cells and interrupted conjugation by killing the Hfr cells with phage T6. The F− cells, which were resistant to phage T6, survivedand were then tested for the presence of genes transferred from the Hfr strain. The results of this experiment are shown in the accompanying graph. On the basis of these data, give the order of the xyl, mtl, mal, and met genes on the bacterial chromosome and indicate the minimum distances between them.arrow_forward
- Three different Hfr strains, derived from the same F strains (H), were mated with F- strains auxotrophic for a number of nutritional requirements (trp bio leu azi mal tyr gal ). Matings were interrupted at various intervals and cells were plated on minimal medium supplemented with particular nutrients to test for gene transfer. The following mapping data was obtained: Genes Hfr strains bio leu azi mal gal trp 17 tyr Hfr H Hfr 1 Hfr 2 Hfr 3 Hfr 4 25 4 10 10 18 3 5 9. 1 16 14 22 15 3 19 19 11 4 8 Draw a circular map of E. coli chromosome. Include distances (in minutes) between genes in your map and label arrowheads to show the origin of transfer for the five Hfr strains. (10arrow_forwardThree different Hfr strains, derived from the same F* strains (H), were mated with F strains auxotrophic for a number of nutritional requirements (trp bio leu azi mal tyr gal ). Matings were interrupted at various intervals and cells were plated on minimal medium supplemented with particular nutrients to test for gene transfer. The following mapping data was obtained: Genes mal Hfr strains leu 25 trp 17 bio azi gal* tyr Hfr H Hfr 1 Hfr 2 Hfr 3 Hfr 4 4 10 10 18 3 9. 16 14 22 15 3 19 19 11 4 8 Draw a circular map of E. coli chromosome. Include distances (in minutes) between genes in your map and label arrowheads to show the origin of transfer for the five Hfr strains.arrow_forwardBy conducting conjugation experiments between Hfr and recipientstrains, Wollman and Jacob mapped the order of many bacterialgenes. Throughout the course of their studies, they identified severaldifferent Hfr strains in which the F-factor DNA had been integratedat different places along the bacterial chromosome. A sample of theirexperimental results is shown in the following table:Explain how these results are consistent with the idea that thebacterial chromosome is circular?arrow_forward
 Human Anatomy & Physiology (11th Edition)BiologyISBN:9780134580999Author:Elaine N. Marieb, Katja N. HoehnPublisher:PEARSON
 Biology 2eBiologyISBN:9781947172517Author:Matthew Douglas, Jung Choi, Mary Ann ClarkPublisher:OpenStax
 Anatomy & PhysiologyBiologyISBN:9781259398629Author:McKinley, Michael P., O'loughlin, Valerie Dean, Bidle, Theresa StouterPublisher:Mcgraw Hill Education,
 Molecular Biology of the Cell (Sixth Edition)BiologyISBN:9780815344322Author:Bruce Alberts, Alexander D. Johnson, Julian Lewis, David Morgan, Martin Raff, Keith Roberts, Peter WalterPublisher:W. W. Norton & Company
 Laboratory Manual For Human Anatomy & PhysiologyBiologyISBN:9781260159363Author:Martin, Terry R., Prentice-craver, CynthiaPublisher:McGraw-Hill Publishing Co.
 Inquiry Into Life (16th Edition)BiologyISBN:9781260231700Author:Sylvia S. Mader, Michael WindelspechtPublisher:McGraw Hill Education