
Foundations of Materials Science and Engineering
6th Edition
ISBN: 9781259696558
Author: SMITH
Publisher: MCG
expand_more
expand_more
format_list_bulleted
Videos
Textbook Question
Chapter 8.15, Problem 30AAP
Consider the binary peritectic iridium–osmium phase diagram of Figure P8.28. Make phase analyses of a 70 wt% Ir–30 wt% Os at the temperatures (a) 2600°C, (b) 2665°C + ΔT, and (c) 2665°C − ΔT. In the phase analyses include:
- i. The phases present
- ii. The chemical compositions of the phases
- iii. The amounts of each phase
- iv. Sketch the microstructure by using 2-cm-diameter circular fields.
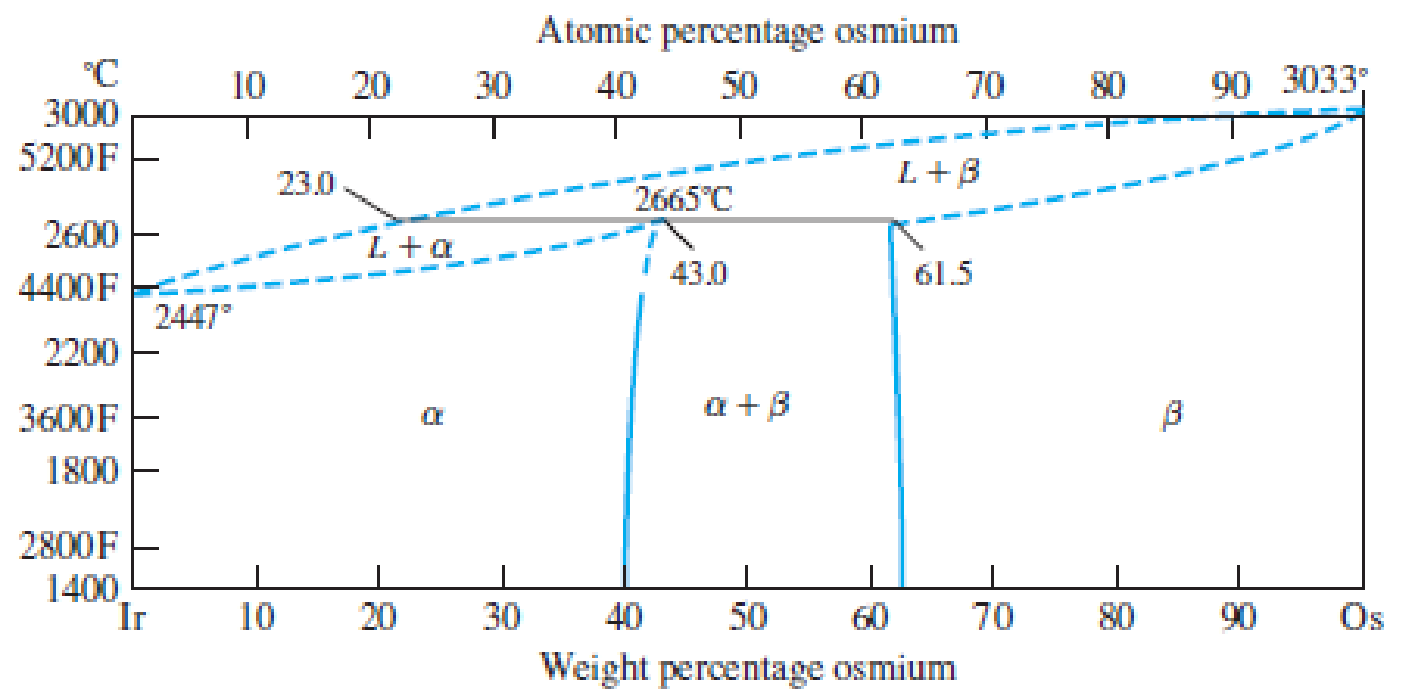
Figure P8.28
The iridium–osmium phase diagram.
Expert Solution & Answer
Want to see the full answer?
Check out a sample textbook solution
Students have asked these similar questions
A 50 wt% Ni–50 wt% Cu alloy is heated to a temperature within the a liquid-phase region. If the composition of the alpha phase is 58 wt% Ni, determine (b) the composition of the liquid phase in wt% Ni
An alloy consisting of completely soluble cadmium (Cd) and zinc (Zn) in the liquid
state, but neither of them dissolves in each other in the solid state. the table shown below shows the
solidification temperatures for various alloys of cadmium and zinc.
1. Draw the equilibrium diagram according to the information given and data in the table and
indicating all important temperature and phases.
2. Find the percentage of each phases and percentage of constituents of the alloy that contain 60 %
Zn and at a temperature 300 °C.
3. Find the melting point for the following alloys 20 % Cd, 80% Cd
4. Draw the internal structure, noting the phases of the following alloys
A) 30 % Cd at 290 °C
b) 60 % Cd at room temperature.
% of Zinc in alloy
Start of solidification ("C)
End of solidification ("C)
0 10 14 20 30 40 50 60
321 290 266 275 293 310 328 345
70 80 90 100
362 390 401 419
266 266 266 266 266 266 266 266 266 266 266 266
Consider the binary alloy phase diagram shown schematically below. The left-hand side denotes phase a, and the right-hand side the phase ß. The
intermediate region is a coexistence regime with both a and ß phases. The three points 1, 2 and 3 in the coexistence region are at 22.8 wt% A, 28.2
wt% A, and 33.7 wt % A respectively. If the points on the phase boundaries L and R are at 20 wt% A and 39 wt % A, respectively, what is the fraction of
a phase at 1, 2 and 3?
(This question has only one correct answer)
T(°C)
A-B binary alloy
1400
Coexistence region
3
1 2
1100
B
20 %
40 %
Weight % A
Chapter 8 Solutions
Foundations of Materials Science and Engineering
Ch. 8.15 - Define (a) a phase in a material and (b) a phase...Ch. 8.15 - In the pure water pressure-temperature equilibrium...Ch. 8.15 - How many triple points are there in the pure iron...Ch. 8.15 - Write the equation for the Gibbs phase rule and...Ch. 8.15 - Refer to the pressuretemperature equilibrium phase...Ch. 8.15 - (a) What is a cooling curve? (b) What type of...Ch. 8.15 - Prob. 7KCPCh. 8.15 - What is an alloy? What is the difference between...Ch. 8.15 - Prob. 9KCPCh. 8.15 - What is the significance of the liquidus curve?...
Ch. 8.15 - Prob. 11KCPCh. 8.15 - Prob. 12KCPCh. 8.15 - Prob. 13KCPCh. 8.15 - Describe the mechanism that produces the...Ch. 8.15 - Can coring and surrounding occur in a...Ch. 8.15 - What is a monotectic invariant reaction? How is...Ch. 8.15 - Write equations for the following invariant...Ch. 8.15 - How are eutectic and eutectoid reactions similar?...Ch. 8.15 - Distinguish between (a) a terminal phase and (b)...Ch. 8.15 - Distinguish between (a) an intermediate phase and...Ch. 8.15 - What is the difference between a congruently...Ch. 8.15 - Consider an alloy containing 70 wt% Ni and 30 wt%...Ch. 8.15 - Consider the binary eutectic coppersilver phase...Ch. 8.15 - If 500 g of a 40 wt% Ag60 wt% Cu alloy is slowly...Ch. 8.15 - A lead-tin (PbSn) alloy consists of 60 wt%...Ch. 8.15 - A PbSn alloy (Fig. 8.12) contains 40 wt% and 60...Ch. 8.15 - An alloy of 30 wt% Pb70 wt% Sn is slowly cooled...Ch. 8.15 - Consider the binary peritectic iridiumosmium phase...Ch. 8.15 - Consider the binary peritectic iridiumosmium phase...Ch. 8.15 - Consider the binary peritectic iridiumosmium phase...Ch. 8.15 - In the copperlead (CuPb) system (Fig. 8.24) for an...Ch. 8.15 - For an alloy of Cu70 wt% Pb (Fig. 8.24), determine...Ch. 8.15 - What is the average composition (weight percent)...Ch. 8.15 - Consider an Fe4.2 wt% Ni alloy (Fig. 8.17) that is...Ch. 8.15 - Consider an Fe5.0 wt% Ni alloy (Fig. 8.17) that is...Ch. 8.15 - Determine the weight percent and composition in...Ch. 8.15 - Determine the composition in weight percent of the...Ch. 8.15 - Draw, schematically, the liquidus and the solidus...Ch. 8.15 - Consider the CuZn phase diagram of Figure 8.26. a....Ch. 8.15 - Consider the nickelvanadium phase diagram of...Ch. 8.15 - Consider the titaniumaluminum phase diagram of...Ch. 8.15 - What is the composition of point y in Figure...Ch. 8.15 - In Figure 8.12, determine the degree of freedom,...Ch. 8.15 - The cooling curve of an unknown metal shows a...Ch. 8.15 - In the PbSn phase diagram (Fig. 8.12), answer the...Ch. 8.15 - Based on the CuAg phase diagram in Figure P8.23,...Ch. 8.15 - Based on the PdAg phase diagram in Figure EP 8.3,...Ch. 8.15 - Prob. 49SEPCh. 8.15 - Derive the lever rule for the amount in weight...Ch. 8.15 - Based on the AlNi phase diagram given in Figure...Ch. 8.15 - Prob. 52SEPCh. 8.15 - Based on the Al2O3SiO2 phase diagram in Figure...Ch. 8.15 - (a) Design a CuNi alloy that will be completely...Ch. 8.15 - Prob. 55SEPCh. 8.15 - Given that Pb and Sn have similar tensile...Ch. 8.15 - Consider the sugarwater phase diagram shown in...Ch. 8.15 - In Figure P8.57, if 60 g of water and 140 g of...Ch. 8.15 - In Figure P8.57, if 30 g of water and 170 g of...Ch. 8.15 - At 80C, if the wt% of sugar is 80%, (a) what...Ch. 8.15 - (a) Based on the phase diagram in Figure P8.61,...Ch. 8.15 - Referring to Figure P8.61. explain what happens as...Ch. 8.15 - Referring to Figure P8.61, (a) explain what...Ch. 8.15 - Using Figure P8.40, explain what the phase diagram...Ch. 8.15 - Using Figure P8.40. explain why, according to the...Ch. 8.15 - (a) In the TiAl phase diagram. Figure P8.42, what...Ch. 8.15 - Draw an approximate hypothetical phase diagram for...Ch. 8.15 - Draw the hypothetical phase diagram for a binary...
Knowledge Booster


Learn more about
Need a deep-dive on the concept behind this application? Look no further. Learn more about this topic, mechanical-engineering and related others by exploring similar questions and additional content below.Similar questions
- Figure 2 refers to the phase diagram for silver and tin. Label the regions (1) to (5) Temperature, 0/°C 1000 800 600 400 200 0 Liquid 2 Ag,Sn 60 a 20 40 80 Mass percentage Ag/% 100 Question 6: What will be observed when liquids of composition of 40% Ag are cooled to 200 K? When will it begin to precipitate? When will it become solid?arrow_forwardA lead-tin (Pb-Sn) alloy of composition 50 wt % Sn and 50 wt % Pb is slowly heated from a temperature of 100 °C. Refer to the phase diagram provided in Figure 1 and answer the following. (i) At what temperature does the first liquid phase form? (ii) What is the composition of this liquid phase? (iii) At what temperature does complete melting of the alloy occur? (iv) What is the composition of the last solid remaining prior to complete melting? Composition (at% Sn) 20 40 60 80 100 327°C 600 300 Liquid 500 232°C a + L 200 B+L 1400 183°C 18.3 61.9 97.8 300 100 a + B 200 H100 20 40 60 80 100 (Pb) Composition (wt% Sn) (Sn) Figure 1. Lead (Pb) and Tin (Sn) Phase diagram Temperature (°C) Temperature (°F)arrow_forwardA 45 wt% Pb-55 wt% Mg alloy is rapidly quenched to room temperature from an elevated temperature in such a way that the high- temperature microstructure is preserved. This microstructure is found to consist of the a phase and Mg2Pb, having respective mass fractions of 0.65 and 0.35. Determine the approximate temperature from which the alloy was quenched. Use Animated Figure. °℃arrow_forward
- In a binary Fe-Fe3C system, what is the transformation that occurs when cooling an austenistic mixture of 2% C by weight from 1100°C to below the eutectoid temperature? What is the microstructure, and how is it formed? What are the concentrations of the total and partial phases? Data: eutectoid temperature: 723 ºC, eutectoid concentration: 0.76% C, limit concentration of ferrite: 0.022%, limit concentration of cementite: 6.7%.arrow_forwardA lead-tin (Pb-Sn) alloy of composition 30 wt % Sn and 70 wt % Pb is slowly heated from a temperature of 140 OC. Refer to the phase diagram provided in Figure 1 and answer the following. (i) At what temperature does the first liquid phase form? (ii) What is the composition of this liquid phase? (iii) At what temperature does complete melting of the alloy occur? (iv) What is the composition of the last solid remaining prior to complete melting?arrow_forwardThe figure below shows Pb-Sn phase diagram. What is the composition of Pb and Sn at point 1? 1200 1000 Liquid a +L 779 C (Tg) B+L 6 800 8.0 71.9 G 91.2 600 400 200 20 40 60 80 100 (Pb) Composition (wt% Sni (Sn) Callister Jr., W.D., 2007 O a. 80 wt % Sn and 20 wt % Pb O b. 10 wt % Sn and 90 wt % Pb O c. 90 wt % Sn and 10 wt % Pb O d. 20 wt % Sn and 80 wt % Pb Temperature ("C)arrow_forward
- Figure below is a binary eutectic copper-silver phase diagram. Consider if 500 grams of an 88 wt% Ag–12 wt% Cu alloy is slowly cooled from 1000oC to 700oC. α-phase is copper-rich solid solution and β-phase is silver-rich solid solution. Density of copper and silver is 8.96 g/cm3 and 10.49 g/cm3 respectively. At 700oC, determine the: 1)composition of the phases present.arrow_forwardTemperature ("C) Temperature ($1 Consider 1 kg of Copper - Silver alloy (Cu - Ag) containing 75 wt% Ag. The phase diagram of the alloy is shown in the figure below. The alloy is cooled to 778 °C (just below the eutectic temperature). Calculate the mass in kg of the eutectic phase B (phase B that appears during the eutectic reaction) that forms? Composition (at% Ag 20 40 60 100 2200 80 1200 2000 Liquidus 1000 LIquid 1800 Solidus 1600 800 779°C (T 80 91.2 1400 IC. 1200 600 Solvus T000 400 800 200 20 40 80 100 (Cu) Composioon wt Aarrow_forwardAccording to the following graph, two samples of 1080 steel are cooled from the eutectoid temperature, one at a cooling rate of 250°C/s and the other at a cooling rate of 7.27x10⁻⁸ °C/s. Specify the phases obtained and explain their formation from thermodynamic and kinetic perspectives. Also, briefly describe their formation. Draw the microstructure of the phases obtained. Sıcaklık (C) 800 700 600 500 400 300 200 100 0 10 1 T M(başlama) M(% 50) M(% 90) 10 M+O -Otektoid Sıcaklık 10² Zaman (s) % 50 10³ 104 105arrow_forward
- Draw thermal equilibrium diagram for the binary alloy system (Si-Au), from the following data:- a- Silicon melts at 1414 °C, and gold melts at 1064 °C. b-Eutectic is formed at 360°C containing 20 Wt% Si -80 Wt% Au, and identify all phases are present in the diagram c-Determine the amount of each phase for the alloy which consist of 60 Wt% Si- 40Wt % Au at 1200 °C and 800 °C ,then determine the amount of eutectic at 200 °C?arrow_forwardIn Figure 1 (phase diagram), an alloy composition of 95 wt% Mg and 5 wt% Al is cooled from 700 C to 475 C. An analysis of the resulting ε solid-phase composition reveals that it has a higher Mg content than is anticipated by the phase diagram.a) Explain why this might be the case and how your reasoning results in the higher-than-expected Mg content.b) Provide a sketch showing the likely distribution of Mg content within the volume of ε solid-phase.arrow_forwarda. Determine the composition of each phase in a Cu-40% Ni alloy at 1300°C, 1270°C, 1250°C, and 1200°C. b. Calculate the amounts of α and L at 1250°C in the Cu-40% Ni alloyarrow_forward
arrow_back_ios
SEE MORE QUESTIONS
arrow_forward_ios
Recommended textbooks for you
 Elements Of ElectromagneticsMechanical EngineeringISBN:9780190698614Author:Sadiku, Matthew N. O.Publisher:Oxford University Press
 Mechanics of Materials (10th Edition)Mechanical EngineeringISBN:9780134319650Author:Russell C. HibbelerPublisher:PEARSON
 Thermodynamics: An Engineering ApproachMechanical EngineeringISBN:9781259822674Author:Yunus A. Cengel Dr., Michael A. BolesPublisher:McGraw-Hill Education
 Control Systems EngineeringMechanical EngineeringISBN:9781118170519Author:Norman S. NisePublisher:WILEY
 Mechanics of Materials (MindTap Course List)Mechanical EngineeringISBN:9781337093347Author:Barry J. Goodno, James M. GerePublisher:Cengage Learning
 Engineering Mechanics: StaticsMechanical EngineeringISBN:9781118807330Author:James L. Meriam, L. G. Kraige, J. N. BoltonPublisher:WILEY
Elements Of Electromagnetics
Mechanical Engineering
ISBN:9780190698614
Author:Sadiku, Matthew N. O.
Publisher:Oxford University Press
Mechanics of Materials (10th Edition)
Mechanical Engineering
ISBN:9780134319650
Author:Russell C. Hibbeler
Publisher:PEARSON
Thermodynamics: An Engineering Approach
Mechanical Engineering
ISBN:9781259822674
Author:Yunus A. Cengel Dr., Michael A. Boles
Publisher:McGraw-Hill Education
Control Systems Engineering
Mechanical Engineering
ISBN:9781118170519
Author:Norman S. Nise
Publisher:WILEY
Mechanics of Materials (MindTap Course List)
Mechanical Engineering
ISBN:9781337093347
Author:Barry J. Goodno, James M. Gere
Publisher:Cengage Learning
Engineering Mechanics: Statics
Mechanical Engineering
ISBN:9781118807330
Author:James L. Meriam, L. G. Kraige, J. N. Bolton
Publisher:WILEY
Intro to Ceramics and Glasses — Lesson 2, Part 1; Author: Ansys Learning;https://www.youtube.com/watch?v=ArDFnBWH-8w;License: Standard Youtube License