
Videos
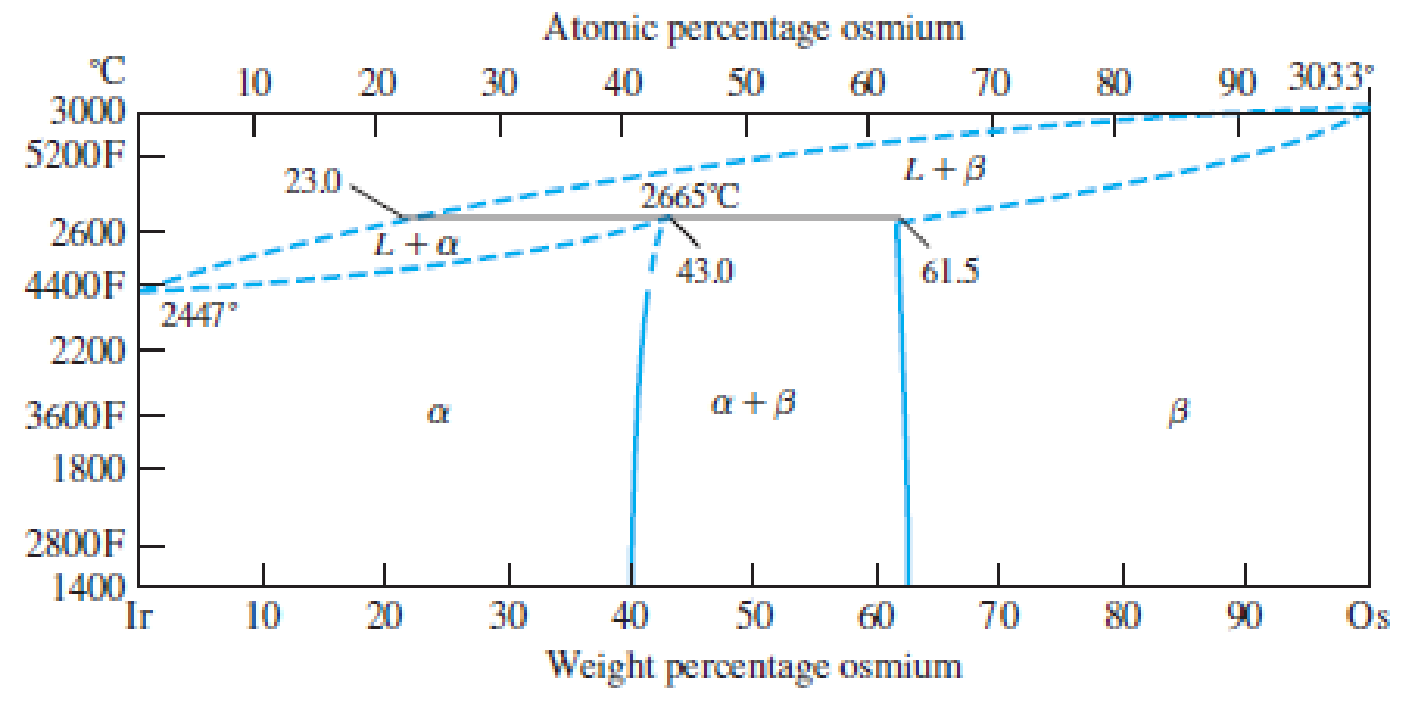
Consider the binary peritectic iridium–osmium phase diagram of Figure P8.28. Make phase analyses of a 40 wt% Ir–60 wt% Os at the temperatures (a) 2600°C, (b) 2665°C + ΔT, (c) 2665°C − ΔT, and (d) 2800°C. Include in the phase analyses the four items listed in Problem 8.28.
(a)
Refer Fig P8.28, and perform a phase analysis of a 40 wt% Ir and 60 wt% Os at temperature of
Include the following in the phase analysis:
- i. The phase present.
- ii. The chemical composition of each phase.
- iii. The amount of every phase is available.
- iv. Draw the microstructure by the help of 2-cm-diameter circular fields.
Explanation of Solution
Refer Figure P8.28, and make a phase analysis at a temperature of
- i. Phases present or available are beta and alpha, that is
- ii. The chemical composition of Os in alpha phase is 42 wt% and in beta phase is 62.5 wt%.
- iii. Express the weight percentage of beta and alpha:
Thus, the weight percentage of alpha and beta is
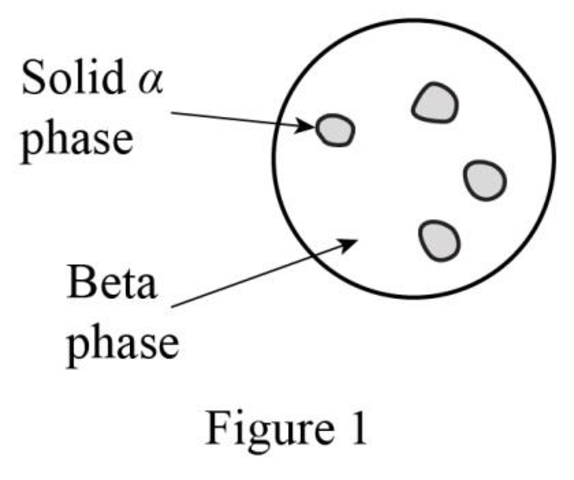
- iv. Show the microstructure as in Figure (1).
(b)
Repeat the same at
Explanation of Solution
Refer Figure P8.28, and make a phase analysis at
- i. Phases present or available are liquid and beta, that is
- ii. The chemical composition of Os in liquid phase is 23 wt% and in beta phase is 61.5 wt%.
- iii. Express the weight percentage of liquid and beta:
Thus, the weight percentage of beta and liquid is
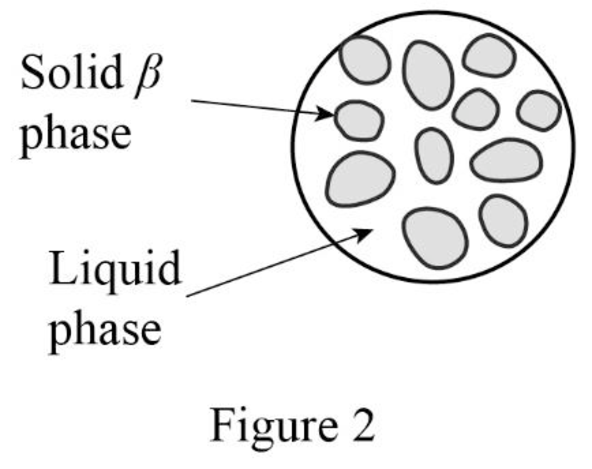
- iv. Show the microstructure as in Figure (2).
(c)
Repeat the same at
Explanation of Solution
Refer Figure P8.28, and make a phase analysis at
- i. Phases present or available are beta and alpha, that is
- ii. The chemical composition of Os in alpha phase is 43 wt% and in beta phase is 61.5 wt%.
- iii. Express the weight percentage of beta and alpha:
Thus, the weight percentage of alpha and beta is
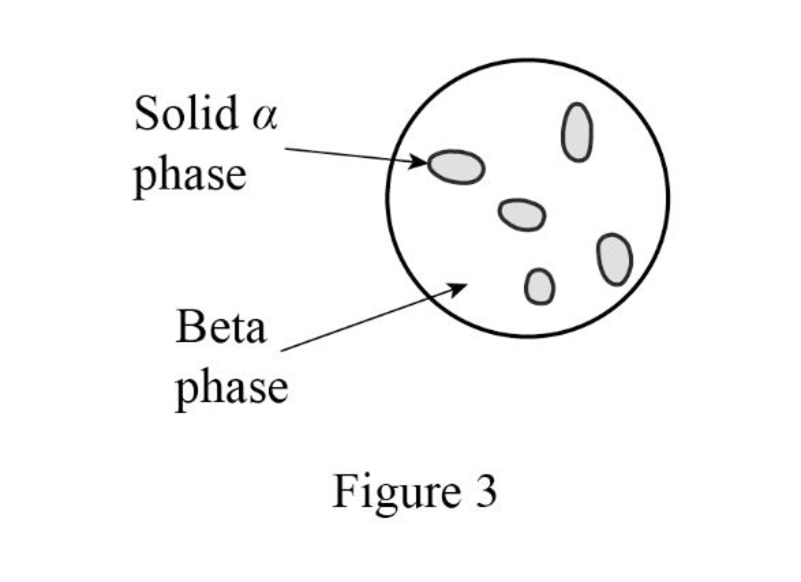
- iv. Show the microstructure as in Figure (3).
(d)
Repeat the same at
Explanation of Solution
Refer Figure P8.28, and make a phase analysis at a temperature of
- i. Phases present or available are beta and liquid, that is
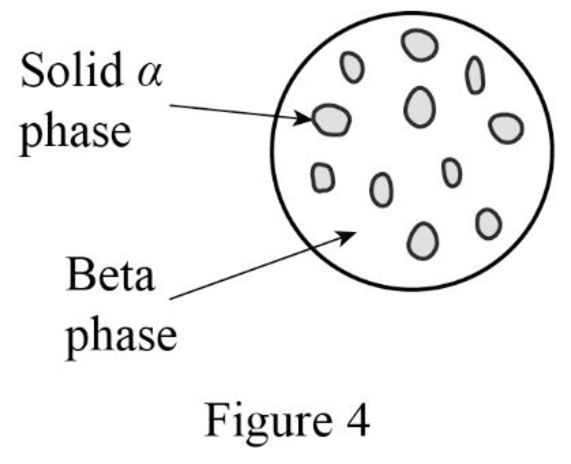
- ii. The chemical composition of Os in liquid phase is 45 wt% and in beta phase is 85 wt%.
- iii. Express the weight percentage of liquid and beta:
Thus, the weight percentage of liquid and beta is
- iv. Show the microstructure as in Figure (4).
Want to see more full solutions like this?
Chapter 8 Solutions
Foundations of Materials Science and Engineering


- a. Determine the composition of each phase in a Cu-40% Ni alloy at 1300°C, 1270°C, 1250°C, and 1200°C. b. Calculate the amounts of α and L at 1250°C in the Cu-40% Ni alloyarrow_forwardAn alloy consisting of completely soluble cadmium (Cd) and zinc (Zn) in the liquid state, but neither of them dissolves in each other in the solid state. the table shown below shows the solidification temperatures for various alloys of cadmium and zinc. 1. Draw the equilibrium diagram according to the information given and data in the table and indicating all important temperature and phases. 2. Find the percentage of each phases and percentage of constituents of the alloy that contain 60 % Zn and at a temperature 300 °C. 3. Find the melting point for the following alloys 20 % Cd, 80% Cd 4. Draw the internal structure, noting the phases of the following alloys A) 30 % Cd at 290 °C b) 60 % Cd at room temperature. % of Zinc in alloy Start of solidification ("C) End of solidification ("C) 0 10 14 20 30 40 50 60 321 290 266 275 293 310 328 345 70 80 90 100 362 390 401 419 266 266 266 266 266 266 266 266 266 266 266 266arrow_forwardRefer to Figure 1 showing the phase diagram for the Fe-Fe3C system. Consider 1.0 kg of austenite containing 1.15 wt% C, cooled to below 727 C (1341 F). What is the proeutectoid phase? How many kilograms each of total ferrite and cementite form? How many kilograms each of pearlite and the proeutectoid phase form? Schematically sketch and label the resulting microstructure.arrow_forward
- A lead-tin (Pb-Sn) alloy of composition 30 wt % Sn and 70 wt % Pb is slowly heated from a temperature of 140 OC. Refer to the phase diagram provided in Figure 1 and answer the following. (i) At what temperature does the first liquid phase form? (ii) What is the composition of this liquid phase? (iii) At what temperature does complete melting of the alloy occur? (iv) What is the composition of the last solid remaining prior to complete melting?arrow_forwardfind the relative amounts (in terms of mass fractions) of the phases for the following alloys and temperature: 90 wt% Zn-10 wt% Cu at 400°C.arrow_forwardReferring to Figure 1, answer the following: What are the liquidus and solidus temperatures for an 80%Pb20%Tl alloy? What is the composition of the solid solution phase for the aforementioned alloy once we hit the liquidus temperature upon cooling? For the same alloy above, use the inverse lever rule to calculate the %solid and %liquid at 325Carrow_forward
- Figure 2 refers to the phase diagram for silver and tin. Label the regions (1) to (5) Temperature, 0/°C 1000 800 600 400 200 0 Liquid 2 Ag,Sn 60 a 20 40 80 Mass percentage Ag/% 100 Question 6: What will be observed when liquids of composition of 40% Ag are cooled to 200 K? When will it begin to precipitate? When will it become solid?arrow_forwardCite the phases that are present and the phase compositions for the following alloys: 1.25 kg Sn and 14 kg Pb at 200°Carrow_forwardIn a binary Fe-Fe3C system, what is the transformation that occurs when cooling an austenistic mixture of 2% C by weight from 1100°C to below the eutectoid temperature? What is the microstructure, and how is it formed? What are the concentrations of the total and partial phases? Data: eutectoid temperature: 723 ºC, eutectoid concentration: 0.76% C, limit concentration of ferrite: 0.022%, limit concentration of cementite: 6.7%.arrow_forward
- Figure below is a binary eutectic copper-silver phase diagram. Consider if 500 grams of an 88 wt% Ag–12 wt% Cu alloy is slowly cooled from 1000oC to 700oC. α-phase is copper-rich solid solution and β-phase is silver-rich solid solution. Density of copper and silver is 8.96 g/cm3 and 10.49 g/cm3 respectively. At 700oC, determine the: 1)composition of the phases present.arrow_forwardDraw thermal equilibrium diagram for the binary alloy system (Si-Au), from the following data:- a- Silicon melts at 1414 °C, and gold melts at 1064 °C. b-Eutectic is formed at 360°C containing 20 Wt% Si -80 Wt% Au, and identify all phases are present in the diagram c-Determine the amount of each phase for the alloy which consist of 60 Wt% Si- 40Wt % Au at 1200 °C and 800 °C ,then determine the amount of eutectic at 200 °C?arrow_forwardUse the phase diagrams for Cu-Ni and Cu-Ag systems below to answer the question: Based on the mechanism, would you expect a solution containing 80 wt% Cu to be stronger if the remaining 20% of the alloy was Ni or Ag? Briefly explainarrow_forward
 Elements Of ElectromagneticsMechanical EngineeringISBN:9780190698614Author:Sadiku, Matthew N. O.Publisher:Oxford University Press
 Mechanics of Materials (10th Edition)Mechanical EngineeringISBN:9780134319650Author:Russell C. HibbelerPublisher:PEARSON
 Thermodynamics: An Engineering ApproachMechanical EngineeringISBN:9781259822674Author:Yunus A. Cengel Dr., Michael A. BolesPublisher:McGraw-Hill Education
 Control Systems EngineeringMechanical EngineeringISBN:9781118170519Author:Norman S. NisePublisher:WILEY
 Mechanics of Materials (MindTap Course List)Mechanical EngineeringISBN:9781337093347Author:Barry J. Goodno, James M. GerePublisher:Cengage Learning
 Engineering Mechanics: StaticsMechanical EngineeringISBN:9781118807330Author:James L. Meriam, L. G. Kraige, J. N. BoltonPublisher:WILEY