
Concept explainers
(a)
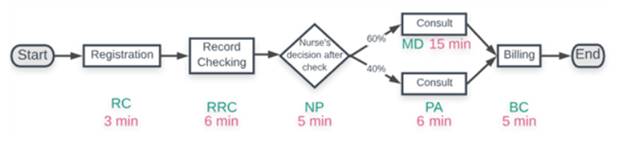
Interpretation: A process flow diagram is to be constructed along withlabeling and the times and percentages.
Concept Introduction:
Any flow unit, when flows through a process, follows L’s Law which states that the Work in Progress and given by,
(a)
Explanation of Solution
Process flow diagram is as follows.
(b)
Interpretation: The throughout in patients is to be determined per hour of each stage in the process.
Concept Introduction:
The throughput of any process is the rate at which outputs are coming out of the process. When the capacity (i.e. the service rate) of a process step is more than or equal to the arrival rate or the demand rate, the throughput will be equal to the demand rate.
On the contrary, if the capacity is less than the demand rate, it means that the process step is a bottleneck and the throughput will be equal to the capacity.
(b)
Explanation of Solution
The throughout in patients per hour of each stage in the process is shown in table below.
| Resource | Demand or arrival rate | Capacity or Service rate | Condition | Throughout rate |
| RC | 10 per hour | 10 per hour | ||
| RRC | 10 per hour | 10 per hour | ||
| NP | 10 per hour | 10 per hour | ||
| PA | 4 per hour | |||
| MD | 4 per hour | |||
| BC | 8 per hour | 8 per hour |
(c)
Interpretation: The labor utilization rates are to be calculated and whether these values appropriate. In case they are not appropriate the way the process can be redesigned is to be determined along with then bottlenecks.
Concept Introduction:
The labor utilization is defined as the fraction of time a resource is busy producing output in the long run. It can be calculated by using the following formula.
(c)
Explanation of Solution
However, note that the labor utilization cannot be more than 100% in long run. However, in short run, we can write it as more than 100% using the above formula.
| Resource | Demand or arrival rate | Capacity or Service rate | Number of servers (N) | Utilization (U) |
| RC | 10 per hour | 1 | 50.00% | |
| RRC | 10 per hour | 1 | 100.00% | |
| NP | 10 per hour | 1 | 83.33% | |
| PA | 1 | 40.00% | ||
| MD | 1 | 150.00% | ||
| BC | 8 per hour | 1 | 66.67% |
The resource RRC and MD are overloaded as the utilization figures suggest. Similarly, the resource RC and PA are under loaded. Possible improvement strategy is to share the loads of work (as they are similar in nature) between RC and RRC. Also, it should be checked whether the 60/40 ratio of diversion to MD and PA can be modified in order to balance their load
At present, the resource MD, having the capacity less than the arrival rate and thus the flow is constrained at MD. So, it is the bottleneck.
(d)
Interpretation: The way by which the given change affect your answer to the preceding questions.
Concept Introduction:
Any flow unit, when flows through a process, follows L’s Law which states that the Work in Progress and given by,
(d)
Explanation of Solution
Due to the change, the process layout will be as follows.
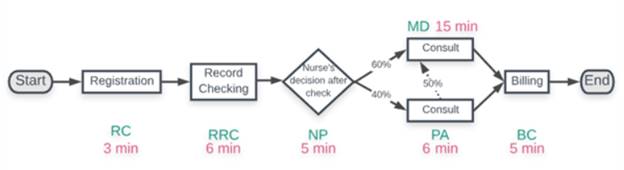
The throughput rates for each resource will be as follows.
| Resource | Demand or arrival rate (D) | Capacity or Service rate | Condition | Throughout rate |
| RC | 10 per hour | 10 per hour | ||
| RRC | 10 per hour | 10 per hour | ||
| NP | 10 per hour | 10 per hour | ||
| PA | 4 per hour | |||
| MD | 4 per hour | |||
| BC | 6 per hour |
The labor utilization of the resources are as follows.
| Resource | Demand or arrival rate | Capacity or Service rate | Number of servers (N) | Utilization (U)
|
| RC | 10 per hour | 1 | 50.00% | |
| RRC | 10 per hour | 1 | 100.00% | |
| NP | 10 per hour | 1 | 83.33% | |
| PA | 1 | 40.00% | ||
| MD | 1 | 200.00% | ||
| BC | 1 | 50.00% |
Note that the utilization of MD has just jumped to 200%.
Want to see more full solutions like this?


- A copier is able to operate for an average of 200 hours between repairs, and the mean repair time is two hours. Determine the availability of the copier.arrow_forwardPrybloxx primarily uses one courier company, AJAX Couriers, for all their deliveries. In some circumstances, where AJAX is too busy and does not have capacity to fulfil deliveries or they do not cover certain areas, only then will Prybloxx make use of a different courier company. Prybloxx has recently had a significant influx of customer complaints regarding goods that have not been delivered, delivered long after the agreed delivery time or damaged once they arrive at the customer. Prybloxx is aware of the effect that this could have on demand for their product, customer goodwill and are now investigating insourcing the delivery of their product to customers. Prybloxx has noted that they have two alternatives in insourcing this department – they can either purchase a local courier company that is considered a going concern or they can purchase all of the required assets and set up such a department themselves. Mr. Pranoto (production manager) has requested that you prepare a report…arrow_forwardAt a cruise ship terminal, each day on average 1000 passengers embark on ships. Onaverage, passengers spend 5 days on their cruise before returning to this terminal. If theflow unit is a passenger, then what are the flow rate and flow time of this process?arrow_forward
- What is the demand rate of the patient turning apparatus shown in the picture? Please explain with numbersarrow_forwardok Inces A campus deli serves 300 customers over its busy lunch period from 11:30 a.m. to 1:30 p.m. A quick count of the number of customers waiting in line and being served by the sandwich makers shows that an average of 10 customers are in process at any point in time. What is the average amount of time that a customer spends in process? Average amount of time minutesarrow_forwardPatients walk in to a doctor’s office every 63 minutes with a standard deviation of 32 minutes on the average. The average examination time is 37 minutes with 32 minutes standard deviation. A patient spends in doctor’s office ______ min on average?arrow_forward
- Terex Corporation is a global manufacturer of aerial work platforms and materials processing machinery. They design, build and support products such as large lifting equipment used in construction. The company makes most pieces to order and customizes them to meet customers’ unique preferences.Terex maintained a manual system for yard management at their transfer centre in Washington that is always full of lifting equipment, which generated excessive costs for what should have been a relatively simple process of locating customers’ units to prepare them for delivery. A wallboard and sticker system was a low-tech solution for identifying equipment items in the yard at Terex. While inexpensive in itself, the solution cost around six minutes every time an employee had to locate a unit in the yard. It also required a considerable number of hours to be spent each month taking physical inventories. After a successful pilot, the company approved a new solution, replacing stickers, yard maps,…arrow_forwardTerex Corporation is a global manufacturer of aerial work platforms and materials processing machinery. They design, build and support products such as large lifting equipment used in construction. The company makes most pieces to order and customizes them to meet customers’ unique preferences.Terex maintained a manual system for yard management at their transfer centre in Washington that is always full of lifting equipment, which generated excessive costs for what should have been a relatively simple process of locating customers’ units to prepare them for delivery. A wallboard and sticker system was a low-tech solution for identifying equipment items in the yard at Terex. While inexpensive in itself, the solution cost around six minutes every time an employee had to locate a unit in the yard. It also required a considerable number of hours to be spent each month taking physical inventories. After a successful pilot, the company approved a new solution, replacing stickers, yard maps,…arrow_forwardAshley’s department store in Kansas City maintains a successful catalog sales department in which four clerk takes orders by telephone. If four clerks are occupied on four-lines, incoming phone calls to the catalog department are answered automatically by a recording machine and asked to wait. As soon as the clerk is free, the party that has waited for the longest is transferred and answered first. Calls come in an average of 3 minutes. The clerk is capable of taking an order in an average of 10 minutes. Calls tend to follow a Poisson distribution, and service times tend to be exponential. a. λ= μ= b. Calculate P0 c. How many callers, on average, are waiting to place an order under the current operating system?arrow_forward
- An automobile service is having difficulty providing oil changes in the 29 minutes or less mentioned in its advertising. You are to analyze the process of changing automobile engine oil. The subject of the study is the service mechanic. The process begins when the mechanic directs the customer’s arrival and ends when the customer pays for the services.arrow_forwardMGMT Hospital Inc is a private concern that recently opened its doors to the public in the suburbsamidst heavy traffic. There are hardly any quiet nights. Sirens are a constant feature. However, onceinside, there is just the hustle and bustle of hospital staff going back and forth. A hospitalreadmission is when a patient who is discharged from the hospital, is re-admitted again within acertain period of time. Hospital readmission rates for certain conditions are now considered anindicator of hospital quality, and also affect the cost of care adversely. For this reason, Centers forMedicare & Medicaid Services established the Hospital Readmissions Reduction Program (HRRP)which aims to improve quality of care for patients and reduce health care spending by applyingpayment penalties to hospitals that have more than expected readmission rates for certain conditions.Although diabetes is not yet included in the penalty measures, the program is regularly adding newdisease conditions to the…arrow_forwardUsually, it takes days to offer a service in e.government. Select one: a. True b. Falsearrow_forward
 Practical Management ScienceOperations ManagementISBN:9781337406659Author:WINSTON, Wayne L.Publisher:Cengage,
 Operations ManagementOperations ManagementISBN:9781259667473Author:William J StevensonPublisher:McGraw-Hill Education
 Operations and Supply Chain Management (Mcgraw-hi...Operations ManagementISBN:9781259666100Author:F. Robert Jacobs, Richard B ChasePublisher:McGraw-Hill Education
 Purchasing and Supply Chain ManagementOperations ManagementISBN:9781285869681Author:Robert M. Monczka, Robert B. Handfield, Larry C. Giunipero, James L. PattersonPublisher:Cengage Learning
 Production and Operations Analysis, Seventh Editi...Operations ManagementISBN:9781478623069Author:Steven Nahmias, Tava Lennon OlsenPublisher:Waveland Press, Inc.