
Concept explainers
Videos
The article “Performance Test Conducted for a Gas Air-Conditioning System” (American Society of Heating, Refrigerating, and Air Conditioning Engineering [1969]: 54) reported the following data on maximum outdoor temperature (x) and hours of chiller operation per day (y) for a 3-ton residential gas air-conditioning system:
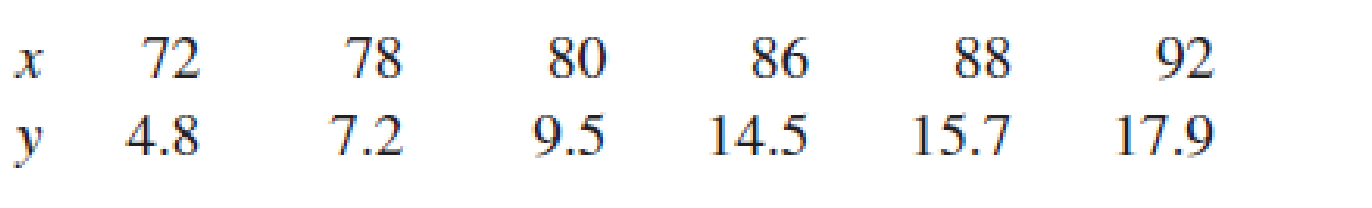
Suppose that the system is actually a prototype model, and the manufacturer does not wish to produce this model unless the data strongly indicate that when maximum outdoor temperature is 82°F. The true average number of hours of chiller operation is less than 12. The appropriate hypotheses are then
H0: α + β(82) = 12 versus Ha: α + β(82) < 12
Use the statistic
which has a t distribution based on (n – 2) df when H0 is true, to test the hypotheses at significance level 0.01.
Want to see the full answer?
Check out a sample textbook solution
Chapter 13 Solutions
Introduction To Statistics And Data Analysis


- Repeat Example 5 when microphone A receives the sound 4 seconds before microphone B.arrow_forwardThe sale of eggs that are contaminated with Salmonella can cause food poisoning among consumers. A large egg producer takes an SRS of 200 eggs from all the eggs shipped in one day. The laboratory reports that 11 of these eggs had Salmonella contamination. Unbeknownst to the producer, 0.2% of all eggs shipped had Salmonella. What is the best description of the values, 11 and 0.2%, in this situation? O 11 is a parameter and 0.2% is a statistic. O 0.2% is a parameter and 11 is a statistic. O Both 0.2% and 11 are parameters. Both 0.2% and 11 are statistics.arrow_forwardApply the predictive control law to a fifth-order process:Y(s)/(s)=1/(5s+1)⁵.Evaluate the effect of tuning paramete rJ on the set-pointresponses for values of J=3, 4, 6, and 8 and Δt=5 min.arrow_forward
- Data from the US Department of Energy’s US Energy Information Administration (eia.doe.gov) provides a look at the energy-related carbon dioxide emissions by end use sector (residential, commercial, industrial, transportation) from years 1990 to 2009. (Report # DOE/EIA0573(2009)). Here we would like to see if the CO2 emissions from the Industrial sector are less than that from the Transportation sector. Below are the results: 14. What type of study is this? a. Paired b. Two-Sample Independent 15. What type of plot would we use? a. Histogram of the differences b. Side-by-side boxplots c. Pie chart d. Bar graph 16. Was the HOV/pooled test used above (hint: look at the df)? YES NO 17. Is there evidence that the CO2 emissions from the Industrial sector are less than that from the Transportation sector? YES NO 18. If we were to test to see if there was a difference between the CO2 emissions from the Industrial sector and the Transportation sector, what would be the p-value? (report to 3…arrow_forwardOnly b.ii, iii and iv please. The output of a solar panel (photovoltaic) system depends on its size. A manufacturer states that the average daily production of its 1.5 kW system is 6.6 kilowatt hours (kWh) for Perth conditions. A consumer group monitored this 1.5 kW system in 20 different Perth homes and measured the average daily production by the systems in these homes over a one month period during October. The data is provided here. (a) Analyse the consumer group’s data to test if the manufacturer’s claim of an average of 6.6 kWh per day is reasonable. State appropriate hypotheses, assumptions and decision rule at α = 0.10. What conclusions would you report to the consumer group? Hint: You will need to find Descriptive Statistics first.) (b) If 48 homes in the central Australian city of Alice Springs had this system installed and similar data wascollected, in order to assess whether average daily production in Alice Springs exceeded 6.6 kWh, (i) what would the alternate hypothesis…arrow_forwardHW 8.3 X W HW 8.3- Math 210, section A X webassign.net/web/Student/Assignment-Responses/submit?pos 0&dep 21620509&tags autos... Marketing companies are interested in knowing the population percent of women who make the majority of household purchasing decisions. When designing a study to determine this population proportion, what is the minimum number you would need to survey to be 90% confident that the population proportion is estimated to within O.05? (Round your answer up to the nearest whole number.) women Show My Work (Optional) Submit Answer View Next Question Question 5 of 6 View Previous Question Extension Request My Assignments Home 6 11/ 4)arrow_forward
- An article in the ACI Materials Journal (Vol. 84, 1987, pp. 213-216) describes several experiments investigating the rodding of concrete to remove trapped air. A 3-inch x 6-inch cylinder was used, and the number of times this rod was used is the design variable. The resulting compressive strength of the concrete specimen is the response. The data are shown in the following table. Compressive Strength (psi) Rodding Level Observations 10 1530 1530 1440 15 1610 1650 1500 20 1560 1730 1530 25 1500 1490 1510 Calculate the test statistic fo- Input answer up to 2 decimal places. Test Statisticf = Blank 1arrow_forwardAn article in the ACI Materials Journal (Vol. 84, 1987, pp. 213-216) describes several experiments investigating the rodding of concrete to remove trapped air. A 3-inch x 6-inch cylinder was used, and the number of times this rod was used is the design variable. The resulting compressive strength of the concrete specimen is the response. The data are shown in the following table. Compressive Strength (psi) Rodding Level Observations 10 1530 1530 1440 15 1610 1650 1500 20 1560 1730 1530 25 1500 1490 1510 Calculate the test statistic fo-arrow_forwardThe Norwegian government wants to know whether restricting the opening hours of liquor stores reduces alcohol consumption. Holger, an employee of Statistics Norway, is asked to investigate this research question. He uses panel data for n = 60 municipalities observed in T = 10 time periods. The data set contains information on per capita alcohol consumption (in liters per year) in municipality i in year t (alcoholit) and on the number of hours that liquor stores were open during year t in municipality i (hoursit). Holger estimates by OLS and obtains the following estimation results. regress alcohol Inhours, robust Linear regression alcohol alcoholit Bo + ßiln(hoursit) + Uit B Inhours cons Coef. 5.288235 2.768777 Robust Std. Err. .7486464 5.686286 t 0.49 P>|t| Number of obs = 0.626 R-squared Root MSE alcoholit = Bo+piln(hoursit) + ai + Uit [95% Conf. Interval] -8.398742 0.0745 .9568 a) Test the null hypothesis that B₁ = 0 at a 1% significance level. b) Use the above estimation results to…arrow_forward
- Health care workers who use latex gloves with glove powder on a daily basis are particularly susceptible to developing a latex allergy. Each in a sample of 45 hospital employees who were diagnosed with a latex allergy based on a skin-prick test reported on their exposure to latex gloves. Summary statistics for the number of latex gloves used per week are x = 19.5 and s = 12.1. Complete parts (a) - (d). a. Give a point estimate for the average number of latex gloves used per week by all health care workers with a latex allergy. 19.5 b. Form a 95% confidence interval for the average number of latex gloves used per week by all health care workers with a latex allergy. (Use integers or decimals for any numbers in the expression. Round to two decimal places as needed.)arrow_forwardThe following TI-84 Plus display presents some population parameters. x = 158 Ex=2680 Ex=359,620 1-Var-Stats Sx 6.066300355 ox=6 ↓n=20 Part: 0/3 Part 1 of 3 (a) Assume the population is bell-shaped. Approximately what percentage of the population values are between 152 and 164? Approximately (Choose one) of the population values fall between 152 and 164.arrow_forward1. An article in the ASCE Journal of Energy Engineering (1999, Vol. 125, pp. 59-75) describes a study of the thermal inertia properties of autoclaved aerated concrete used as a building material. Five samples of the material were tested in a structure, and the average interior temperatures (•C) reported were as follows: 23.01, 22.22, 22.04, 22.62, and 22.59. 1.1. Test the hypotheses H0 : µ =22.5 versus H1 :µ + 22.5, using a=0.05. Find the P-value 1.2. Explain how the question could be answered by constructing a two-sided confidence interval on the mean interior temperature. Find the confidence interval.arrow_forward
 Calculus For The Life SciencesCalculusISBN:9780321964038Author:GREENWELL, Raymond N., RITCHEY, Nathan P., Lial, Margaret L.Publisher:Pearson Addison Wesley,
 Algebra & Trigonometry with Analytic GeometryAlgebraISBN:9781133382119Author:SwokowskiPublisher:Cengage
 Trigonometry (MindTap Course List)TrigonometryISBN:9781337278461Author:Ron LarsonPublisher:Cengage Learning