
Videos
The article first introduced in Exercise 13.34 of Section 13.3 gave data on the dimensions of 27 representative food products.
- a. Use the data set given there to test the hypothesis that there is a positive linear relationship between x = minimum width and y = maximum width of an object.
- b. Calculate and interpret se.
- c. Calculate a 95% confidence interval for the
mean maximum width of products with a minimum width of 6 cm. - d. Calculate a 95% prediction interval for the maximum width of a food package with a minimum width of 6 cm.
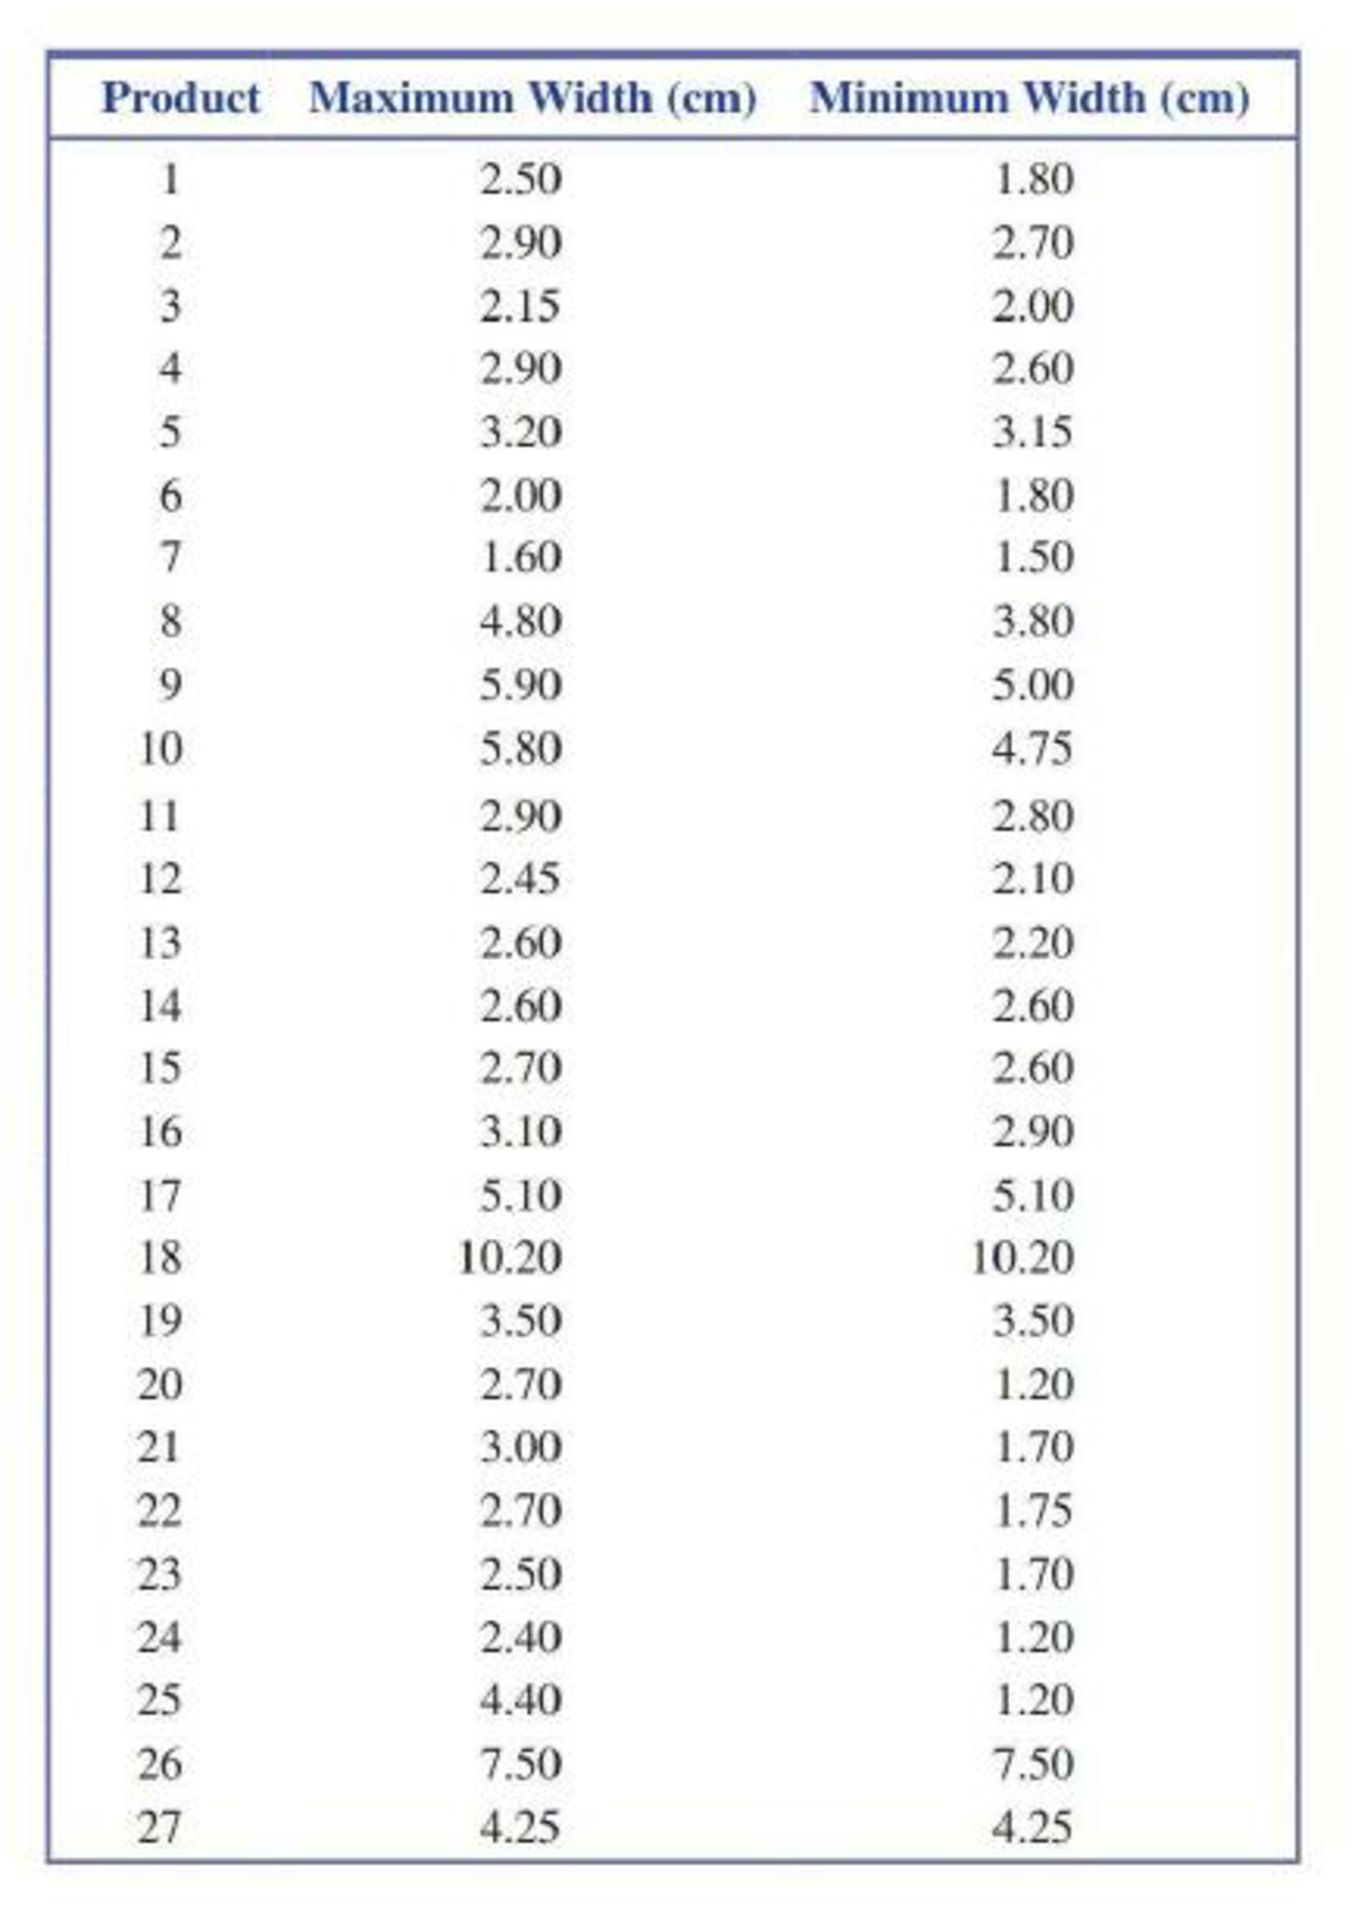
13.34 The article “Vital Dimensions in Volume Perception: Can the Eye Fool the Stomach?” (Journal of Marketing Research [1999]: 313–326) gave the accompanying data on the dimensions of 27 representative food products (Gerber baby food, Cheez Whiz, Skippy Peanut Butter, and Ahmed’s tandoori paste, to name a few).
- a. Fit the simple linear regression model that would allow prediction of the maximum width of a food container based on its minimum width.
- b. Calculate the standardized residuals (or just the residuals if a computer program that doesn’t give standardized residuals is used) and make a residual plot to determine whether there are any outliers.
- c. The data point with the largest residual is for a 1-liter Coke bottle. Delete this data point and determine the equation of the regression line. Did deletion of this point result in a large change in the equation of the estimated regression line?
- d. For the regression line of Part (c), interpret the estimated slope and, if appropriate, the intercept.
- e. For the data set with the Coke bottle deleted, are the assumptions of the simple linear regression model reasonable? Give statistical evidence.
a.
Check whether there is a positive linear relationship between minimum and maximum width of an object.
Answer to Problem 44E
There is convincing evidence that there is a positive linear relationship between minimum and maximum width of an object.
Explanation of Solution
Calculation:
The given data provide the dimensions of 27 representative food products.
1.
Here,
2.
Null hypothesis:
That is, there is no linear relationship between minimum and maximum width of an object.
3.
Alternative hypothesis:
That is, there is a positive linear relationship between minimum and maximum width of an object.
4.
Here, the significance level is
5.
Test Statistic:
The formula for test statistic is,
In the formula, b denotes the estimated slope,
6.
A standardized residual plot is shown below.
Standardized residual values and standardized residual plot:
Software procedure:
Step-by-step procedure to compute standardized residuals and its plot using MINITAB software:
- Select Stat > Regression > Regression > Fit Regression Model
- In Response, enter the column of Maximum width.
- In Continuous Predictors, enter the columns of Minimum width.
- In Graphs, select Standardized under Residuals for Plots.
- In Results, select for all observations under Fits and diagnostics.
- In Residuals versus the variables, select Minimum width.
- Click OK.
Output obtained the MINTAB software is given below:
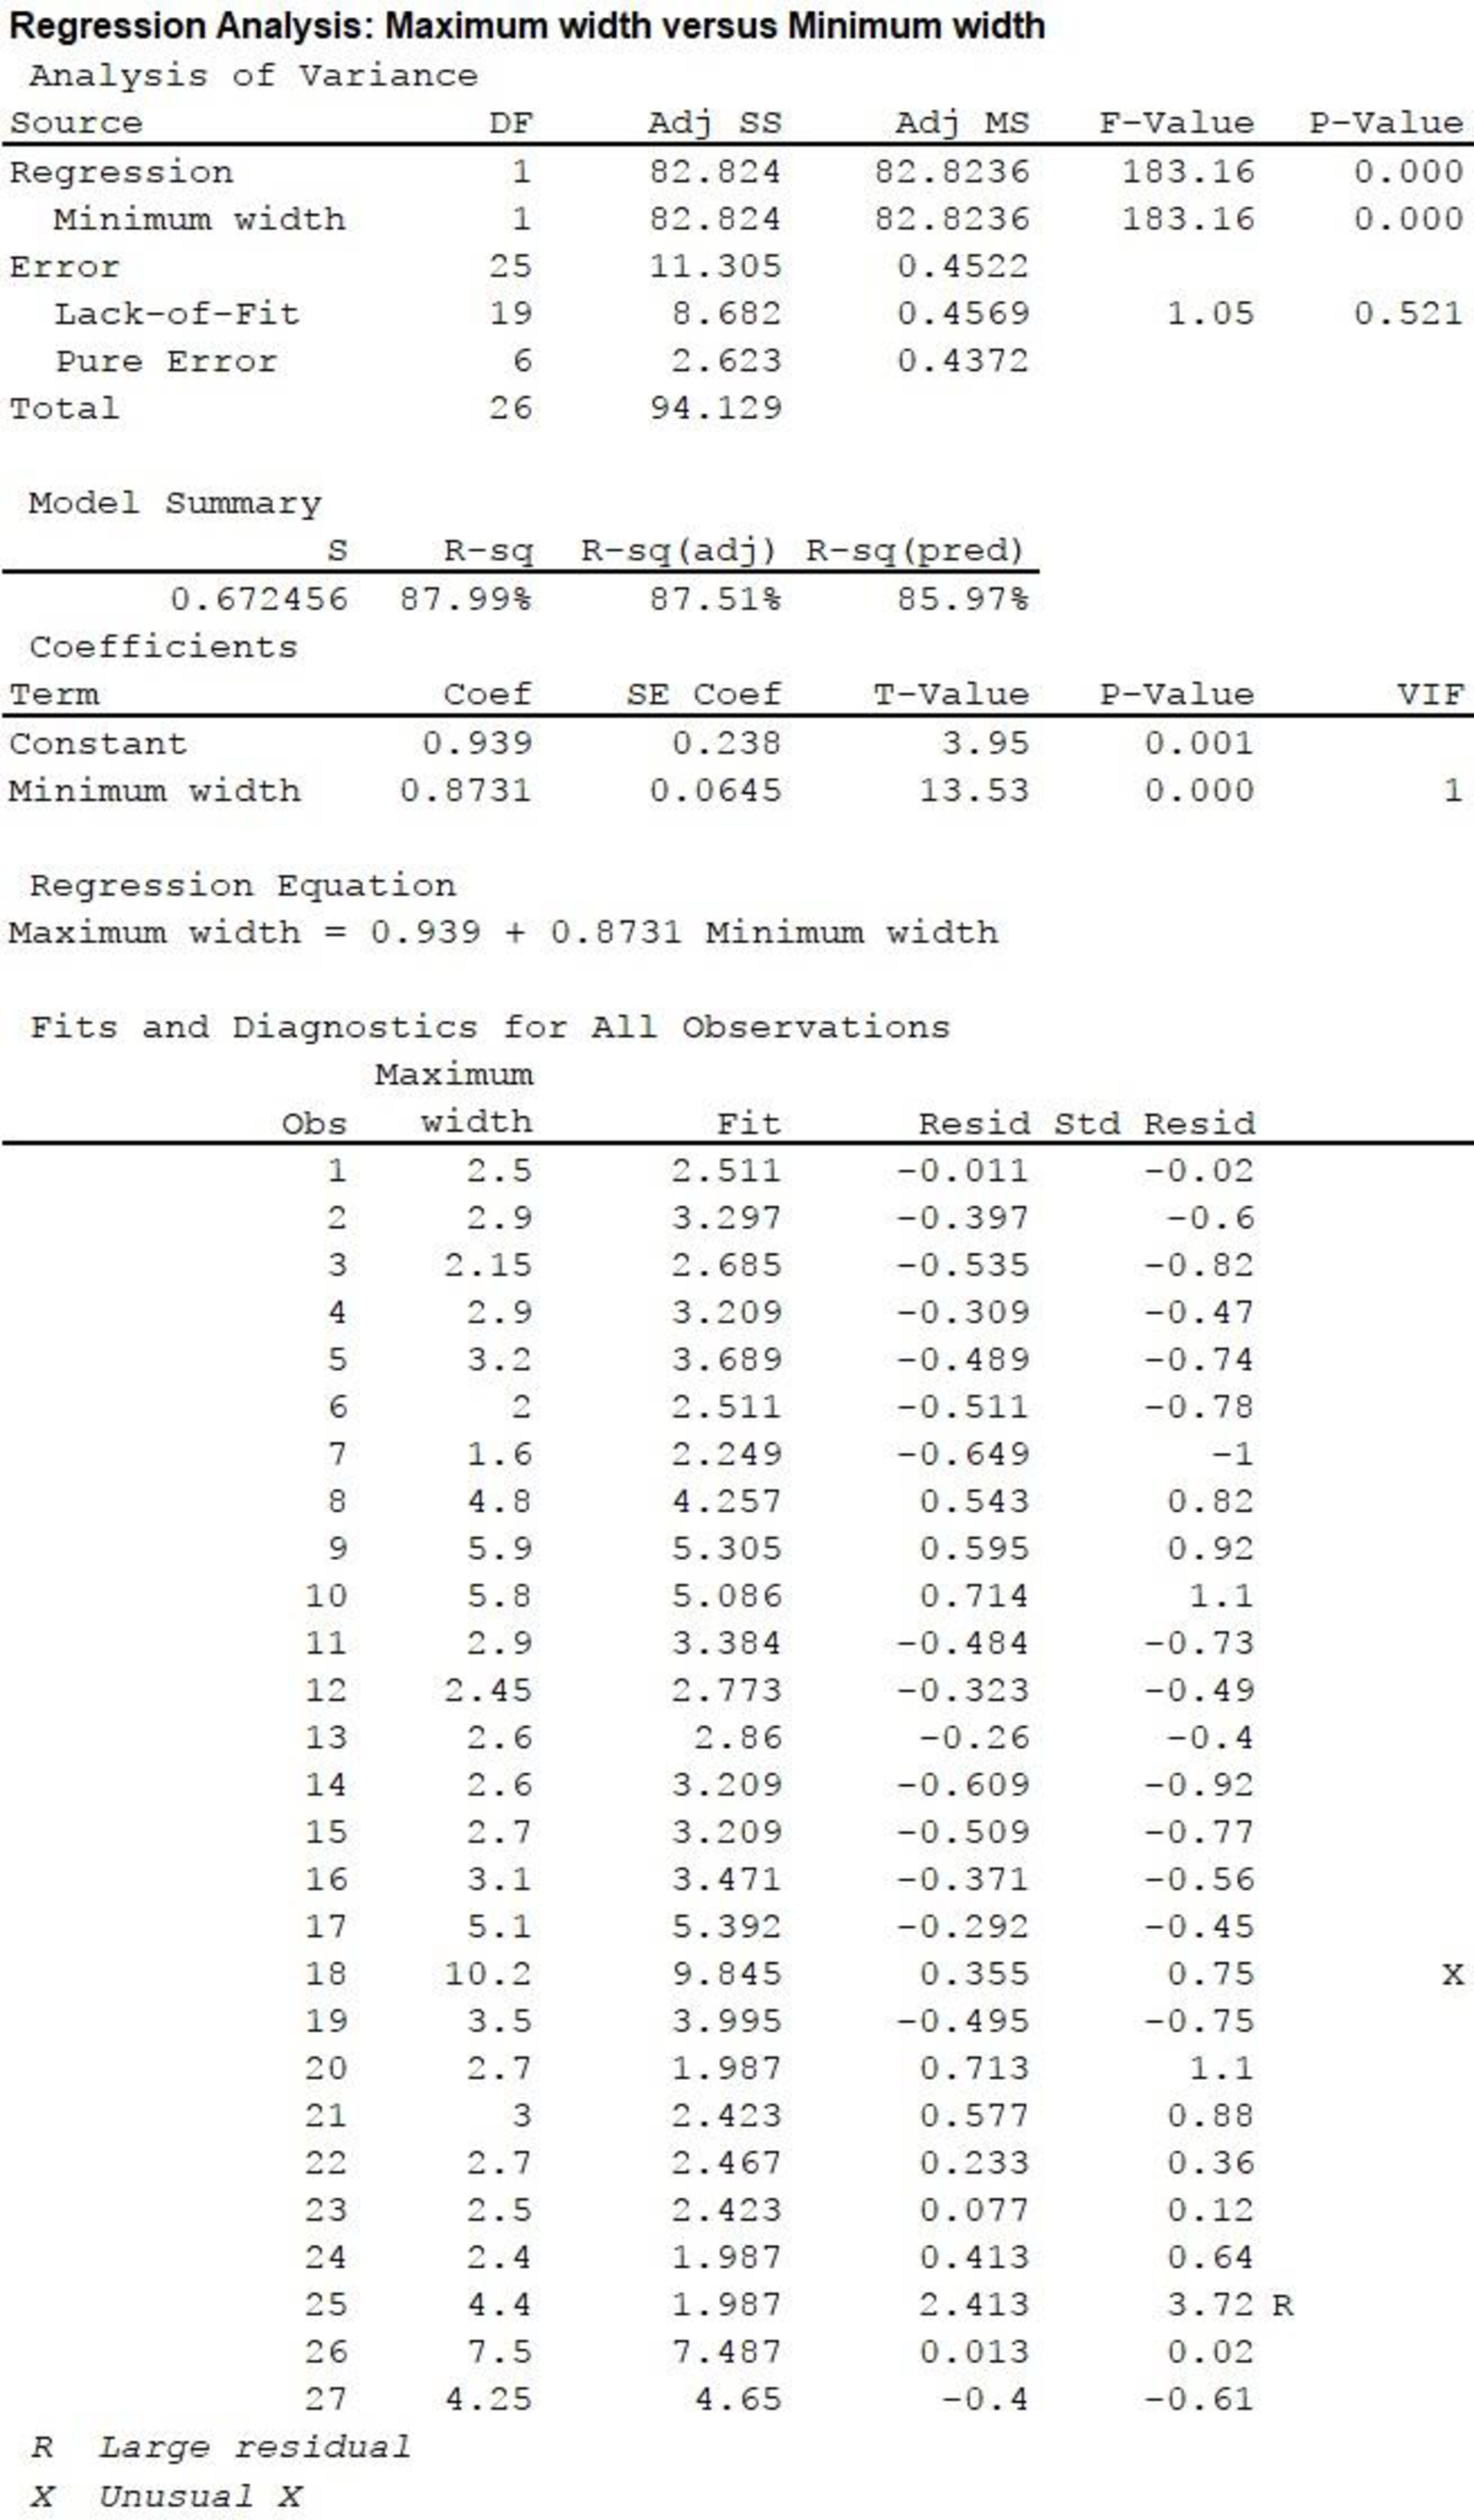
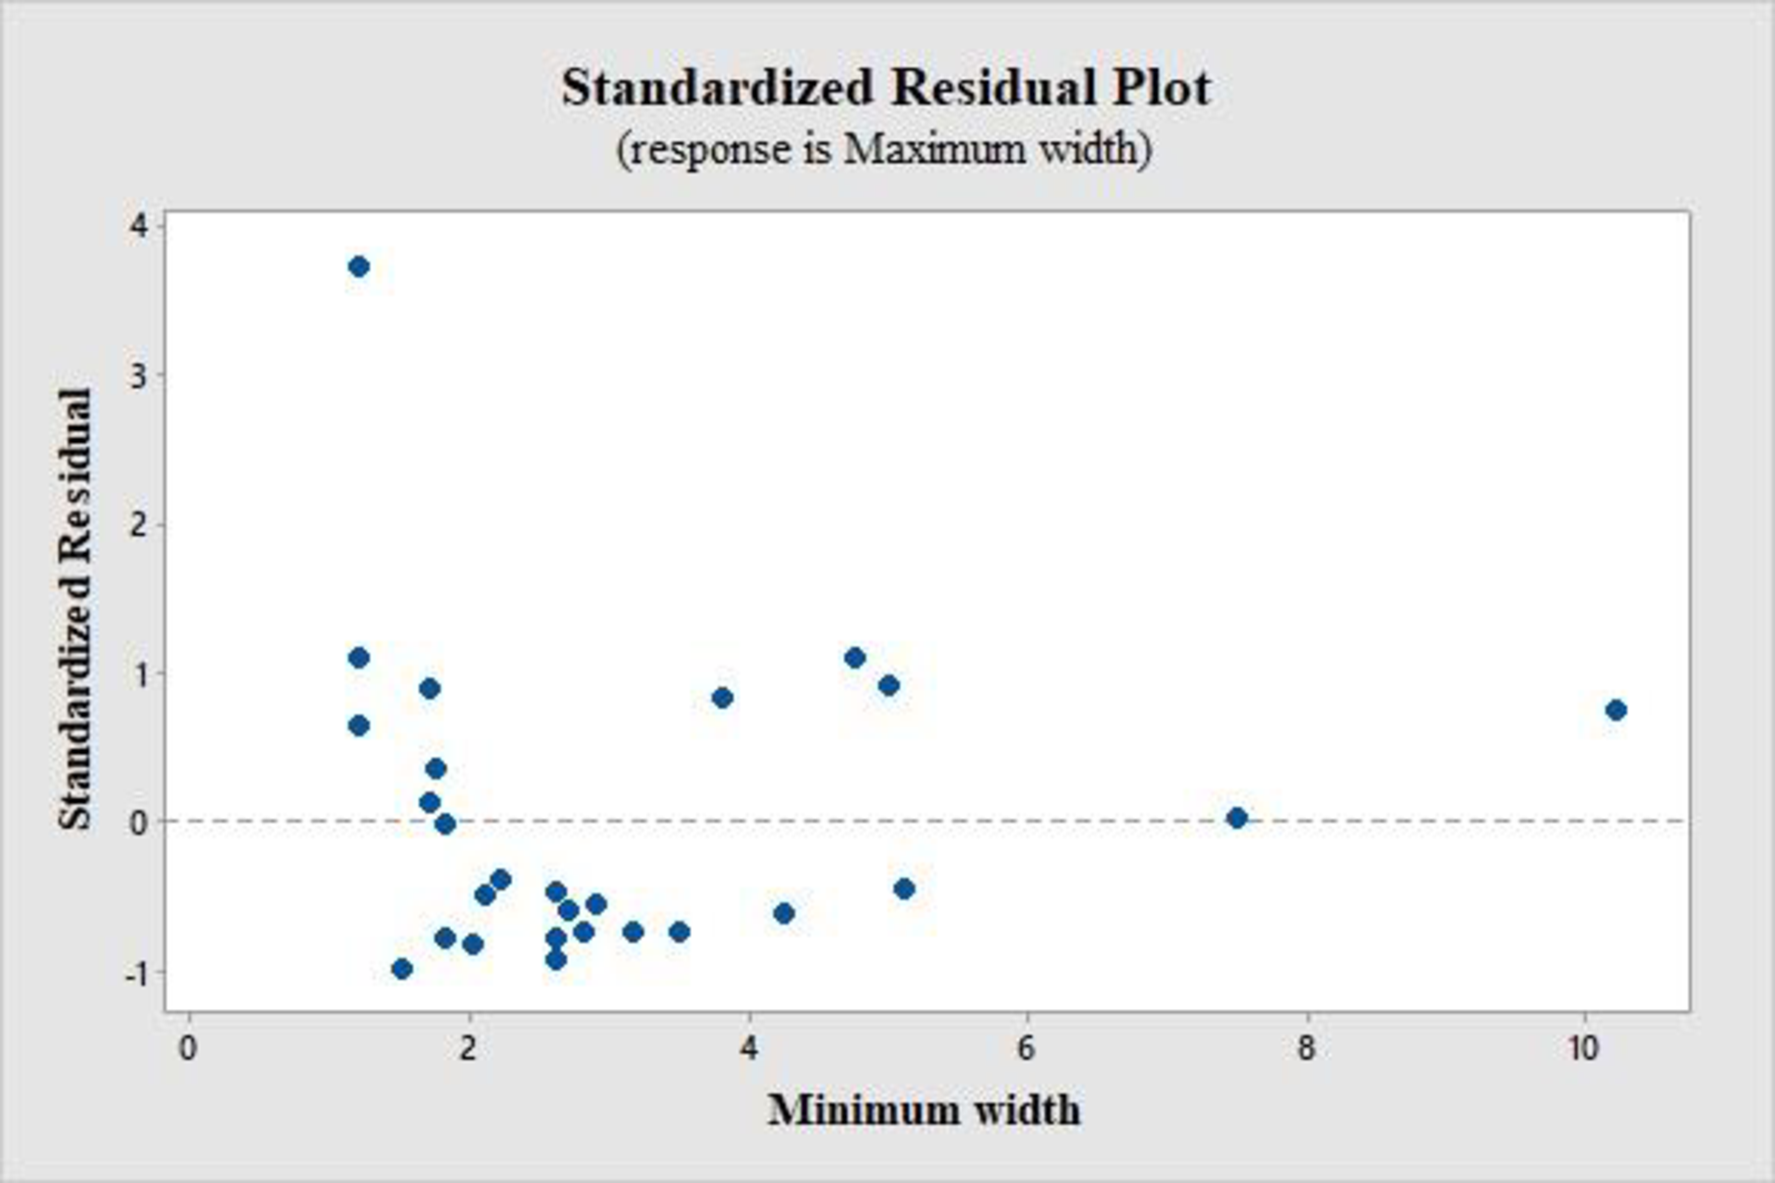
From the standardized residual plot, it is observed that one point lies outside the horizontal band of 3 units from the central line of 0. The standardized residual for this outlier is 3.72, which is for the product 25.
Assumption:
Here, the assumption made is that, the simple linear regression model is appropriate for the data, even though there is one extreme standardized residual.
7.
Calculation:
Test Statistic:
In the MINITAB output, the test statistic value is displayed in the column “T-value” corresponding to “Minimum width”, in the section “Coefficients”. The value is 13.53.
8.
P-value:
From the above output, the correponding P-value is 0.
9.
Rejection rule:
If
Conclusion:
The P-value is 0.
The level of significance is 0.05.
The P-value is less than the level of significance.
That is,
Based on the rejection rule, reject the null hypothesis.
Thus, there is convincing evidence that there is a positive linear relationship between minimum and maximum width of an object.
b.
Compute and interpret
Answer to Problem 44E
Explanation of Solution
Calculation:
From the MINITAB output in Part (a), it is clear that
On an average, there is a 67.246% deviation of the maximum width in the sample from the value predicted by least-squares regression.
c.
Find the 95% confidence interval for the mean maximum width of products, for a minimum width of 6 cm.
Answer to Problem 44E
The 95% interval for the mean maximum width of products, for a minimum width of 6 cm is (5.708, 6.647).
Explanation of Solution
Calculation:
The confidence interval for
From the MINITAB output in Part (a), the estimated linear regression line is
Point estimate:
The point estimate is calculated as follows.
Estimated standard deviation:
For the given x values, the summation values are given in the following table.
| Minimum width (X) | |
| 1.8 | 3.24 |
| 2.7 | 7.29 |
| 2 | 4 |
| 2.6 | 6.76 |
| 3.15 | 9.9225 |
| 1.8 | 3.24 |
| 1.5 | 2.25 |
| 3.8 | 14.44 |
| 5 | 25 |
| 4.75 | 22.5625 |
| 2.8 | 7.84 |
| 2.1 | 4.41 |
| 2.2 | 4.84 |
| 2.6 | 6.76 |
| 2.6 | 6.76 |
| 2.9 | 8.41 |
| 5.1 | 26.01 |
| 10.2 | 104.04 |
| 3.5 | 12.25 |
| 1.2 | 1.44 |
| 1.7 | 2.89 |
| 1.75 | 3.0625 |
| 1.7 | 2.89 |
| 1.2 | 1.44 |
| 1.2 | 1.44 |
| 7.5 | 56.25 |
| 4.25 | 18.0625 |
The value of
Substitute,
Formula for Degrees of freedom:
The formula for degrees of freedom is,
The number of data values given is 27, that is
Critical value:
From the Appendix: Table of t Critical Values:
- Locate the value 25 in the degrees of freedom (df) column.
- Locate the 0.95 in the row of central area captured.
- The intersecting value that corresponds to the df 25 with confidence level 0.95 is 2.060.
Thus, the critical value for
Substitute,
Therefore, one can be 95% confident that the mean maximum width of products with a minimum width of 6 cm will be between 5.708 cm and 6.647 cm.
d.
Find a 95% prediction interval for the mean maximum width of products with a minimum width of 6 cm.
Answer to Problem 44E
The 95% prediction interval for the mean maximum width of products with a minimum width of 6 cm is (4.716, 7.640).
Explanation of Solution
Calculation:
The confidence interval for
The estimated standard deviation of the amount by which a single y observation deviates from the value predicted by an estimated regression line is,
Substitute
From Part (c), the critical value for
Substitute,
Therefore, the 95% prediction interval for the mean maximum width of products with a minimum width of 6 cm is (4.716, 7.640).
Want to see more full solutions like this?
Chapter 13 Solutions
Introduction To Statistics And Data Analysis


- A simple random sample of heights of 6400Englishmen has a mean of 67.85 inches and SD 2.56 inches, while a simple random sample of heights of 1600 Australians has a mean of 68.55 inches and SD of 2.52 inches. D the data indicate that Australians are, on the average, taller than Englishmen?arrow_forwardA paper investigated the driving behavior of teenagers by observing their vehicles as they left a high school parking lot and then again at a site approximately 1 2 mile from the school. Assume that it is reasonable to regard the teen drivers in this study as representative of the population of teen drivers. Amount by Which Speed Limit Was Exceeded MaleDriver FemaleDriver 1.2 -0.1 1.4 0.4 0.9 1.1 2.1 0.7 0.7 1.1 1.3 1.2 3 0.1 1.3 0.9 0.6 0.5 2.1 0.5 (a) Use a .01 level of significance for any hypothesis tests. Data consistent with summary quantities appearing in the paper are given in the table. The measurements represent the difference between the observed vehicle speed and the posted speed limit (in miles per hour) for a sample of male teenage drivers and a sample of female teenage drivers. (Use μmales − μfemales.Round your test statistic to two decimal places. Round your degrees of freedom down to the nearest whole number. Round your p-value to…arrow_forwardA paper investigated the driving behavior of teenagers by observing their vehicles as they left a high school parking lot and then again at a site approximately 1 2 mile from the school. Assume that it is reasonable to regard the teen drivers in this study as representative of the population of teen drivers. Amount by Which Speed Limit Was Exceeded MaleDriver FemaleDriver 1.3 -0.1 1.3 0.4 0.9 1.1 2.1 0.7 0.7 1.1 1.3 1.2 3 0.1 1.3 0.9 0.6 0.5 2.1 0.5 (a) Use a .01 level of significance for any hypothesis tests. Data consistent with summary quantities appearing in the paper are given in the table. The measurements represent the difference between the observed vehicle speed and the posted speed limit (in miles per hour) for a sample of male teenage drivers and a sample of female teenage drivers. (Use μmales − μfemales.Round your test statistic to two decimal places. Round your degrees of freedom down to the nearest whole number. Round your p-value to…arrow_forward
 Linear Algebra: A Modern IntroductionAlgebraISBN:9781285463247Author:David PoolePublisher:Cengage Learning
 Calculus For The Life SciencesCalculusISBN:9780321964038Author:GREENWELL, Raymond N., RITCHEY, Nathan P., Lial, Margaret L.Publisher:Pearson Addison Wesley,
 Glencoe Algebra 1, Student Edition, 9780079039897...AlgebraISBN:9780079039897Author:CarterPublisher:McGraw Hill
 Big Ideas Math A Bridge To Success Algebra 1: Stu...AlgebraISBN:9781680331141Author:HOUGHTON MIFFLIN HARCOURTPublisher:Houghton Mifflin Harcourt