
Videos
The largest commercial fishing enterprise in the southeastern United States is the harvest of shrimp. In a study described in the paper “Long-term Trawl Monitoring of White Shrimp, Litopenaeus setiferus (Linnaeus), Stocks within the ACE Basin National Estuariene Research Reserve, South Carolina“ (Journal of Coastal Research [2008]: 193–199), researchers monitored variables thought to be related to the abundance of white shrimp.
One variable the researchers thought might be related to abundance is the amount of oxygen in the water. The relationship between the mean number of white shrimp caught in a single outing and oxygen saturation was described by fitting a regression line using data from 10 randomly selected offshore sites. Computer output is shown below.
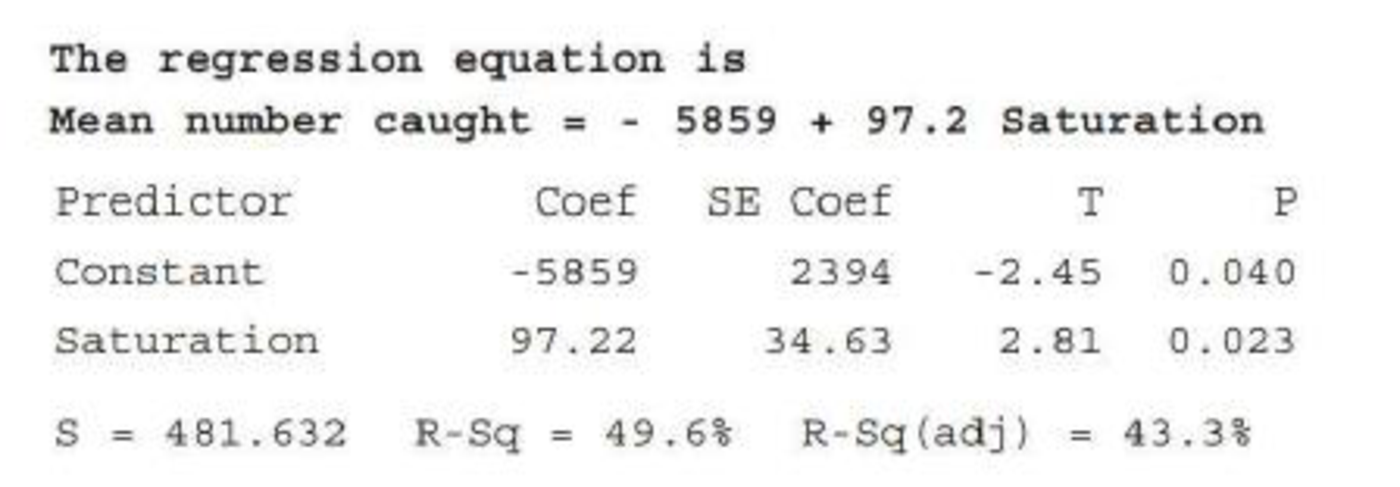
- a. Is there convincing evidence of a useful linear relationship between the mean number of shrimp caught and oxygen saturation? Explain. (Hint: See Example 13.5.)
- b. Is the relationship strong? Explain why or why not.
- c. Construct a 95% confidence interval for β and interpret it in context. (Hint: See Example 13.4.)

Trending nowThis is a popular solution!

Chapter 13 Solutions
Introduction To Statistics And Data Analysis


- A 2009 study to investigate the dominant paws in cats was described in Animal Behaviour (Volume 78, Issue 2). The researchers used a random sample of 42 domestic cats. In this study, each cat was shown a treat (5 grams of tuna), and while the cat watched, the food was placed inside a jar. The opening of the jar was small enough that the cat could not stick its head inside to remove the treat. The researcher recorded the paw that was first used by the cat to try to retrieve the treat. This was repeated 100 times for each cat (over a span of several days). The paw used most often was deemed the dominant paw (note that one cat used both paws equally and was classified as "ambidextrous"). Of the 42 cats studied, 20 were classified as "left-pawed". Describe how you would estimate the standard error from the bootstrap distribution.arrow_forwardA healthcare provider notices an outbreak of foodborne illness among individuals who attended a holiday cookout. Which study type would be most beneficial in identifying the source of the outbreak?arrow_forwardThe article "The Effectiveness of Child Restraint Systems for Children Aged 3 Years or Younger During Motor Vehicle Collisions: 1996 to 2005" (T. Rice and C. Anderson, American Journal of Public Health, 2009:252–257) studied a large number of automobile accidents involving small children. Following are the numbers of infants who used various types of restraints, categorized by age. Age in Years 2 Safety seat 1143 1328 1086 Seat belt 41 93 172 No restraint 270 249 368 Can you conclude that the proportions of infants using the various types of restraints differ with age?arrow_forward
- In the article “The Eastern Cottonmouth (Agkistrodon piscivorus) at the Northern Edge of Its Range” (Journal of Herpetology, Vol. 29, No. 3, pp. 391–398), Blem and Blem examined the reproductive characteristics of the eastern cottonmouth, a once widely distributed snake whose numbers have decreased recently due to encroachment by humans. A simple random sample of 44 female cottonmouths yielded a sample mean of ??̅ = 7.6 young per litter. Assume σ = 2.4. a. Is the sample mean likely to equal μ exactly? Explain your answer b. Find the 95% Confidence Interval. c. How large a sample would be needed to get at 99% confidence interval with a margin of error of just 0.1?arrow_forwardThe article “The Effect of Restricting Opening Hours on Alcohol-Related Violence” (S. Duailibi, W. Ponicki, et al., American Journal of Public Health, 2007:2276–2280) presented homicide rates for the years 1995–2005 for the town of Diadema, Brazil. In 2002, a law was passed requiring bars to close at 11 pm each night. After the law's passage, the homicide rate dropped by an average of 9 homicides per month, a statistically significant decrease. Which of the following is the best conclusion? a) It is reasonable to conclude that the law is responsible for a reduction of 9 homicides per month. b) It is reasonable to conclude that the law is responsible for a reduction in homicides, but the actual amount might be somewhat more or less than 9 per month. c) It is reasonable to conclude that the homicide rate decreased, but the law may not have anything to do with the decrease. d) It is plausible that the homicide rate may not have decreased at all after the passage of the law.arrow_forwardIn a study, the effects of the mane of a male lion as a signal of quality to mates and rivals was explored. Four life-sized dummies of male lions provided a tool for testing female response to the unfamiliar lions whose manes varied by length (long or short) and color (blonde or dark). The female lions were observed to see whether they approached each of the four life-sized dummies. Complete parts (a) through (e) below. a. Identify the experimental units. Choose the correct answer below. The female lions The male dummies The mane colors The mane lengths Part 2 b. Identify the response variable. Choose the correct answer below. A. Whether or not (yes or no) the mane length affected how the female lions reacted to a male dummy. B. Whether or not (yes or no) the female lions approached the same dummies. C. Whether or not (yes or no) the female lions approached a male dummy. D. Whether or not…arrow_forward
- Cheek teeth of extinct primates. The characteristics of cheek teeth (e.g., molars) can provide anthropologists with information on the dietary habits of extinct mammals. The cheek teeth of an extinct primate species were the subject of research reported in the American Journal of Physical Anthropology (Vol. 142, 2010). A total of 18 cheek teeth extracted from skulls discovered in western Wyoming were analyzed. Researchers recorded the dentary depth of molars (in millimeters) for a sample of 18 cheek teeth extracted from skulls. These depth measurements are listed in the accompanying table. Anthropologists know that the mean dentary depth of molars in an extinct primate species— called Species A—is 15 millimeters. Is there evidence to indicate that the sample of 18 cheek teeth come from some other extinct primate species (i.e., some species other than Species A)? The data are given below (you will need to put it into a single column). You will need to calculate the sample…arrow_forwardWe have a random sample of data on women living in NSW in 2020. During the period covered by our data there were COVID lockdowns in some areas but not in other areas. These lockdowns closed schools and required all but essential workers to work from home or stay at home and not work if they could not work from home. Our data contains the following variables: hours = a woman’s number of hours of work per week kids = a woman’s number of children living at home lockdown = a dummy variable equal to one if the woman is living in an area under a lockdown order and 0 is she is living in an area not locked down. We consider the model: hours = β0 + β1lockdown + β2kids + β3lockdown∗kids + u Which of the following measures the effect of the number of children on hours of work for women living in areas that were locked down? a) β0 b) β2 c) β2 + β3 d) β3 e) none of the other possible answers are correctarrow_forwardThe characteristics of check teeth (e.g., molars) can provide anthropologists with information on the dietary habits of extinct mammals. The check teeth of an extinct primate species was the subject of research reported in the American Journal of Physical Anthropology (Vol. 142, 2010). A total of 18 check teeth extracted from skulls discovered in western Wyoming were analyzed. Each tooth was classified according to degree of wear (unworn, slight, light-moderate, moderate, moderate-heavy, or heavy). The 18 measurements are listed here. Data on Degree of Wear Unknown Slight Unknown Slight Unknown Heavy Moderate Unknown Slight Light-moderate Unknown Light-moderate Moderate-heavy Moderate Moderate Unworn Slight Unknown Identify the variable measured in the study and its type (qualitative and quantitative) Form frequency distribution. Identify the degree of wear category that occurred most often in the sample of 18 check teeth.arrow_forward
- Cloud seeding has been studied for many decades as a weather modification procedure (for an interesting study of this subject, see the article in Technometrics, "A Bayesian Analysis of a Multiplicative Treatment Effect in Weather Modification", Vol. 17, pp. 161-166). The rainfall in acre-feet from 20 clouds that were selected at random and seeded with silver nitrate follows: 18.0, 30.7, 19.8, 27.1, 22.3, 18.8, 31.8, 23.4, 21.2, 27.9. 31.9.27.1, 25.0, 24.7, 26.9. 21.8, 29.2, 34.8, 26.7, 31.6 Can you support a claim that mean rainfall from seeded clouds exceeds 25 acre-feet? Use a-0.01. The appropriate decision for the test is to reject the null hypothesis. True Falsearrow_forwardThe epidemiological, clinical, and bacteriological aspects of shigellosis were studied in a population of hospitalized children in northern Israel. Shigellosis invades epithelial cells of the colon and causes inflammation a severe cases of diarrhea and dysentery. Below is a table that lists the frequencies of two different species of Shigella: S. sonnei and S. Flexneri between hospitalized and non-hospitalized Jews and Arabs. a) Combine hospitalized and non-hospitalized children, what is the overall prevalence of: sonnei among Jewish children: ____________________________ sonnei among Arab children: ____________________________ Flexneri among Jewish children: ____________________________ Flexneri among Arab children: ____________________________ b) Calculate a 95% confidence interval for the population difference in prevalence of S. Flexneri between hospitalized Jewish children and hospitalized Arab children. Briefly interpret the confidence interval. c) Conduct the appropriate…arrow_forwardThe American Society for Microbiology (ASM) and the Soap and Detergent Association (SDA) jointly commissioned two separate studies during 2007, both of which were conducted by Harris Interactive. In one of the studies, 1001 adults were interviewed by telephone and asked about their hand-washing habits. In the other study, the hand-washing behavior of 6076 adults was inconspicuously observed within public restrooms in four U.S. cities. Address the following: a. In the telephone interviews, 921 of the adults said they always wash their hands in public restrooms. Use this result to obtain a point estimate for the proportion of adults who say they always wash their hands in public restrooms. b. Verify that the requirements for constructing a confidence interval for p from part (a) are satisfied. c. Using the results from the telephone interviews, construct and interpret a 95% confidence interval for the proportion of adults who say they always wash their hands in public restrooms. d. Is it…arrow_forward
 Glencoe Algebra 1, Student Edition, 9780079039897...AlgebraISBN:9780079039897Author:CarterPublisher:McGraw Hill