
Videos
a.
Check whether the data contradict the prior belief.
State and test the appropriate hypotheses using a 0.10 level of significance.
a.
Explanation of Solution
The data is on age (x) and percentage of cribriform area of the lamina scleralis occupied by pores (y). The researchers believed that the average decrease in percentage area associated with a 1 year age increase was 0.5%.
1.
Here,
2.
Null hypothesis:
That is, the average decrease in percentage area is 0.5.
3.
Alternative hypothesis:
That is, the average decrease in percentage area is not 0.5.
4.
Here, the significance level is
5.
Test Statistic:
The formula for test statistic is,
In the formula, b denotes the estimated slope,
6.
The data are plotted in the scatter plot below.
If the scatterplot of the data shows a linear pattern, and the vertical variability of points does not appear to be changing over the range of x values in the sample, then it can be said that the data is consistent with the use of the simple linear regression model.
Software procedure:
Step-by-step procedure to obtain the scatterplot using MINITAB software:
- Choose Graph>Scatter plot.
- Select Simple.
- Click OK.
- Under Y variables, enter the column of y.
- Under X variables, enter the column of x.
- Click OK.
The output using MINITAB software is given below:
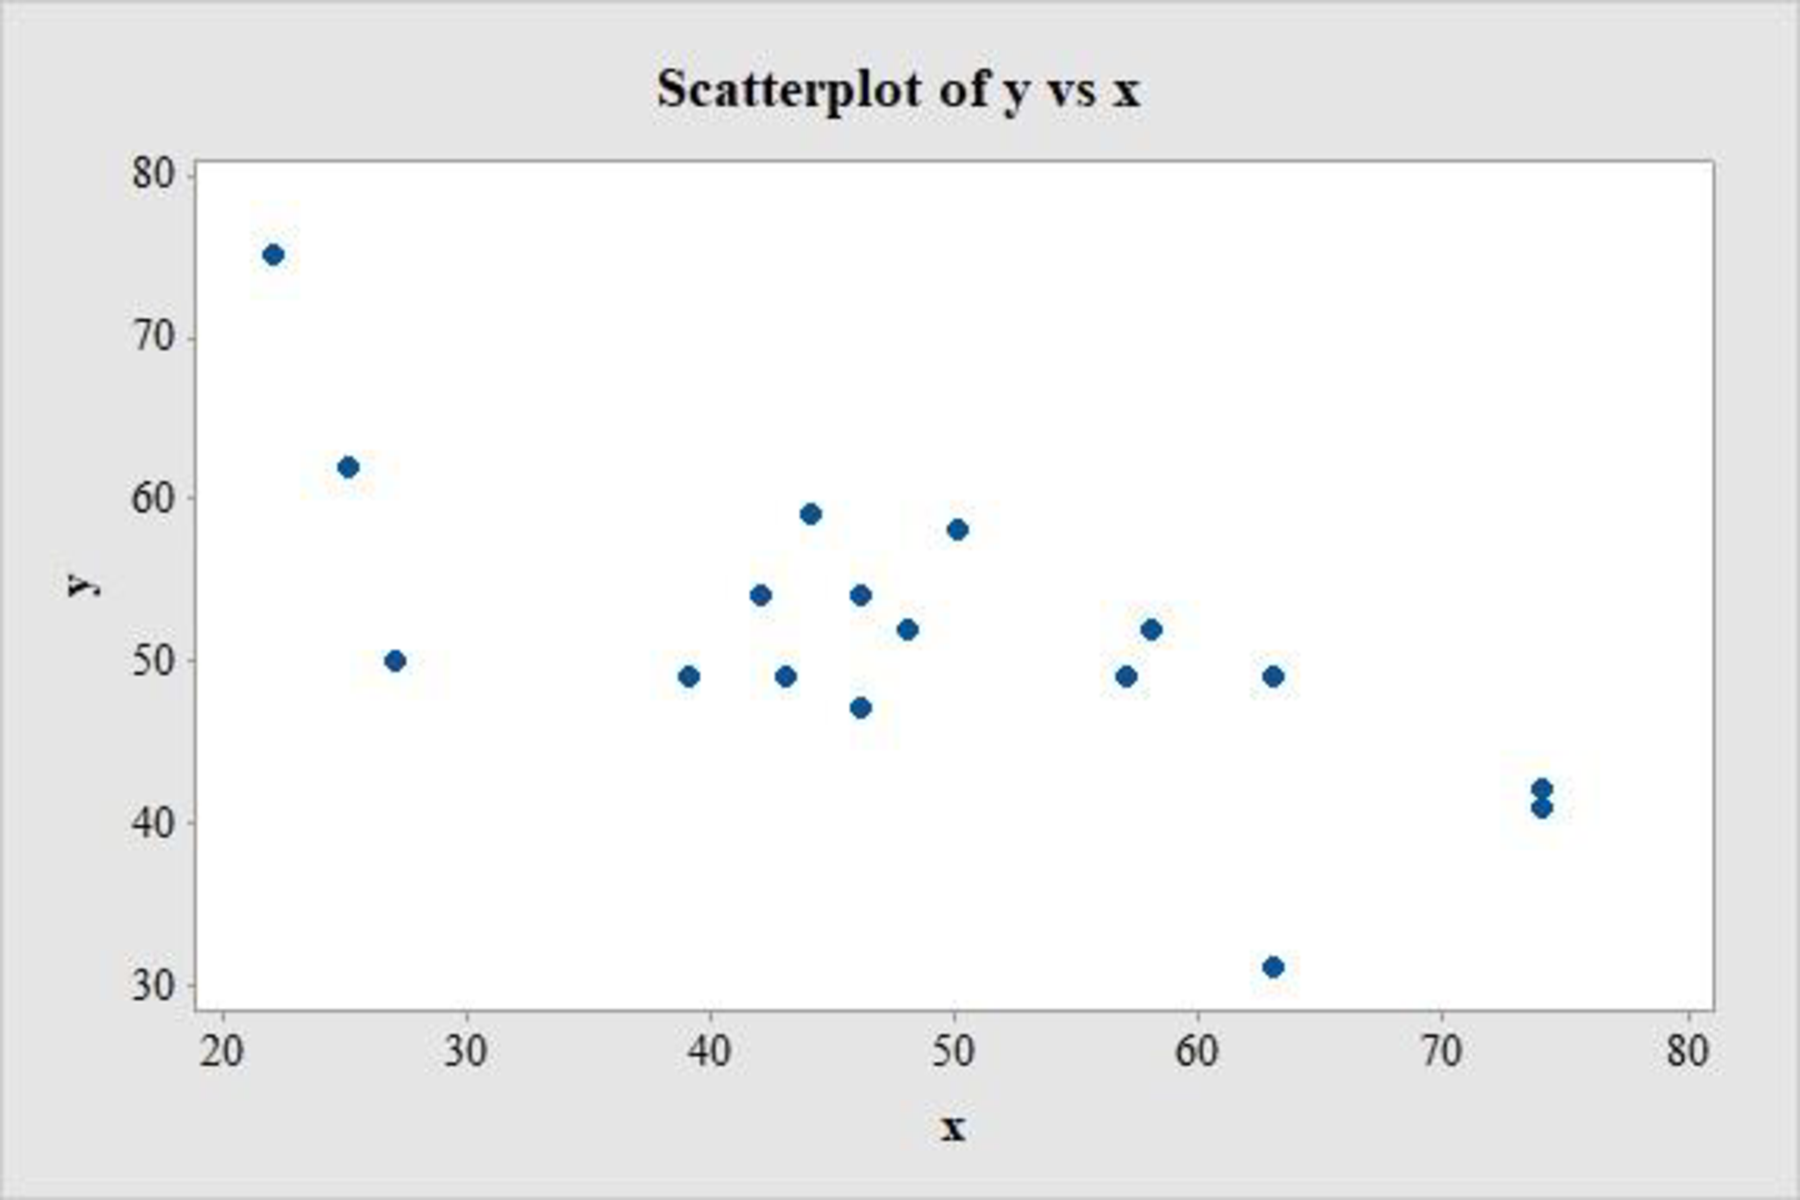
The scatter plot shows no apparent curve and there are no extreme observations. There is no change in the y values as the value of x changes and there are no influential points. Therefore, the simple linear regression model seems appropriate for the data set.
Assumption:
Here, the assumption made is that, the simple linear regression model is appropriate.
7.
Calculation:
The values required for the calculation of t is obtained in the following steps:
Software procedure:
Step-by-step procedure to obtain regression line using MINITAB software:
- Choose Stat > Regression > Regression > Fit Regression Model.
- Under Responses, enter the column of values y.
- Under Continuous predictors, enter the column of values x.
- Click OK.
Output using MINITAB software is given below:
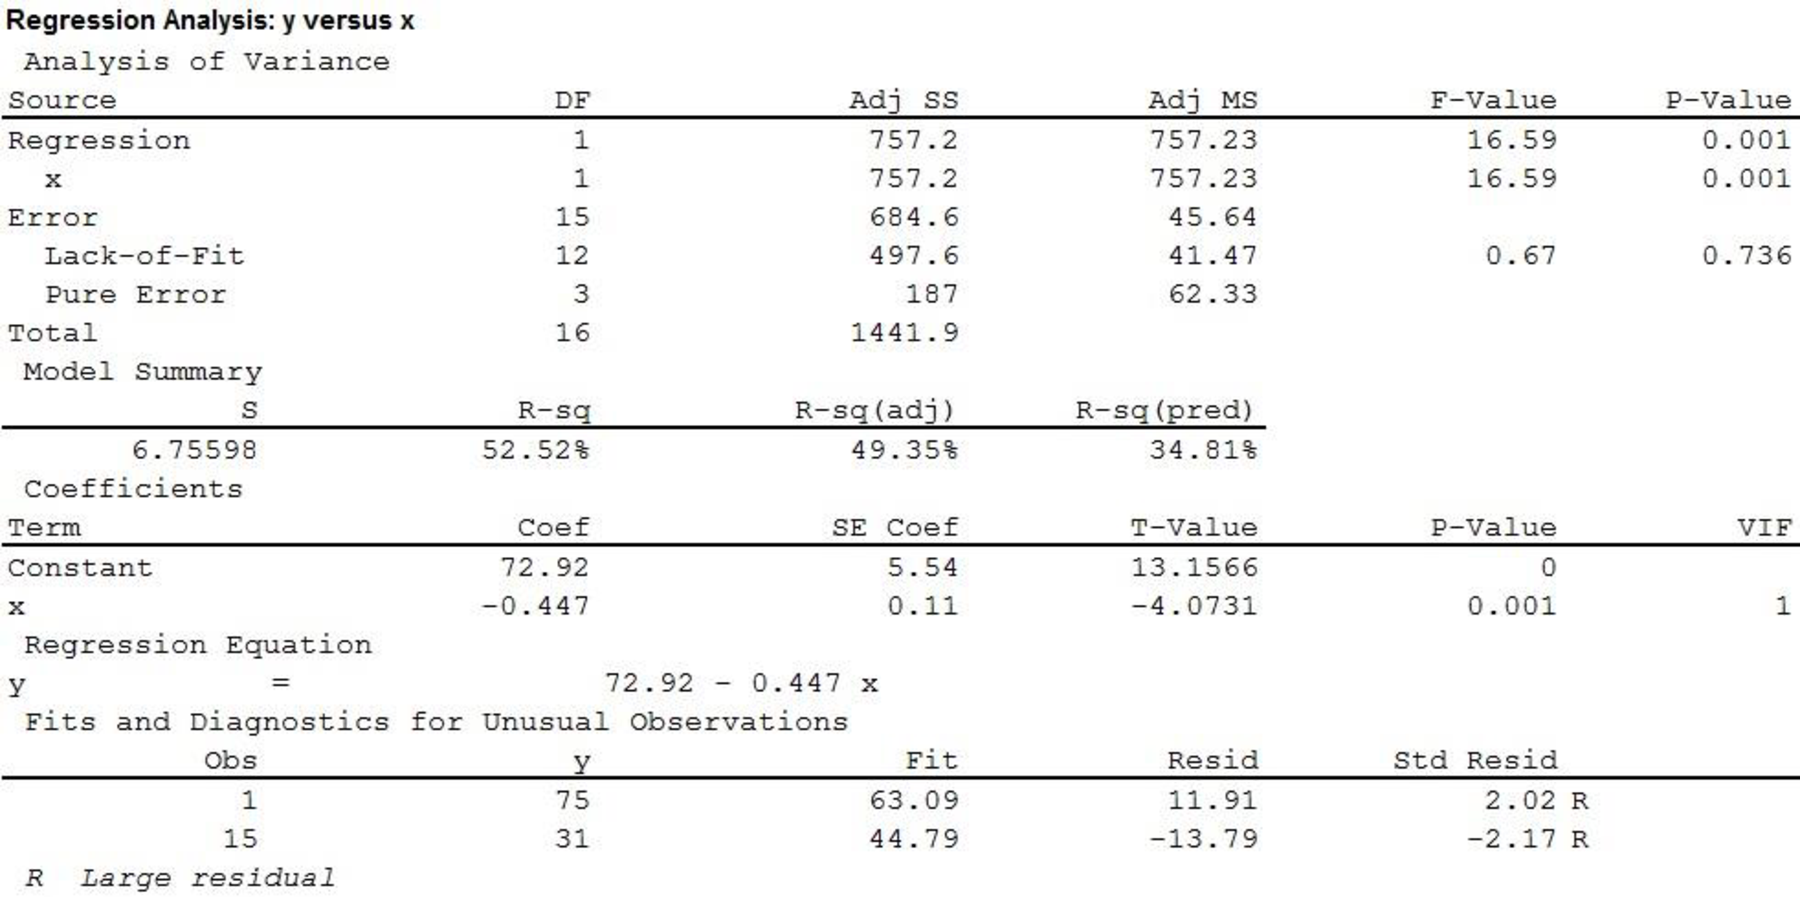
Since, the output provides test statistic value for a hypothesized mean of 0, the test statistic value for a hypothesized mean of –0.5 is obtained below.
For the given x values,
Substitute,
Hence, the test statistic value is 0.488.
8.
Formula for Degrees of freedom:
The formula for degrees of freedom is as follows:
Degrees of freedom:
The number of data values given are 17, that is
P-value:
Formula for p-value:
The P-value is,
The test statistic value is 0.488. The value of
Software procedure:
Step-by-Step procedure to find probability using MINITAB software:
- Choose Graph > Probability Distribution Plot.
- Choose View Probability > OK.
- From Distribution, choose ‘t’ distribution.
- Enter Degrees of freedom as 15.
- Click the Shaded Area tab.
- Choose X Value and Right tail for the region of the curve to shade.
- Enter the X value as 0.488.
- Click OK.
Output using MINITAB software is as follows:
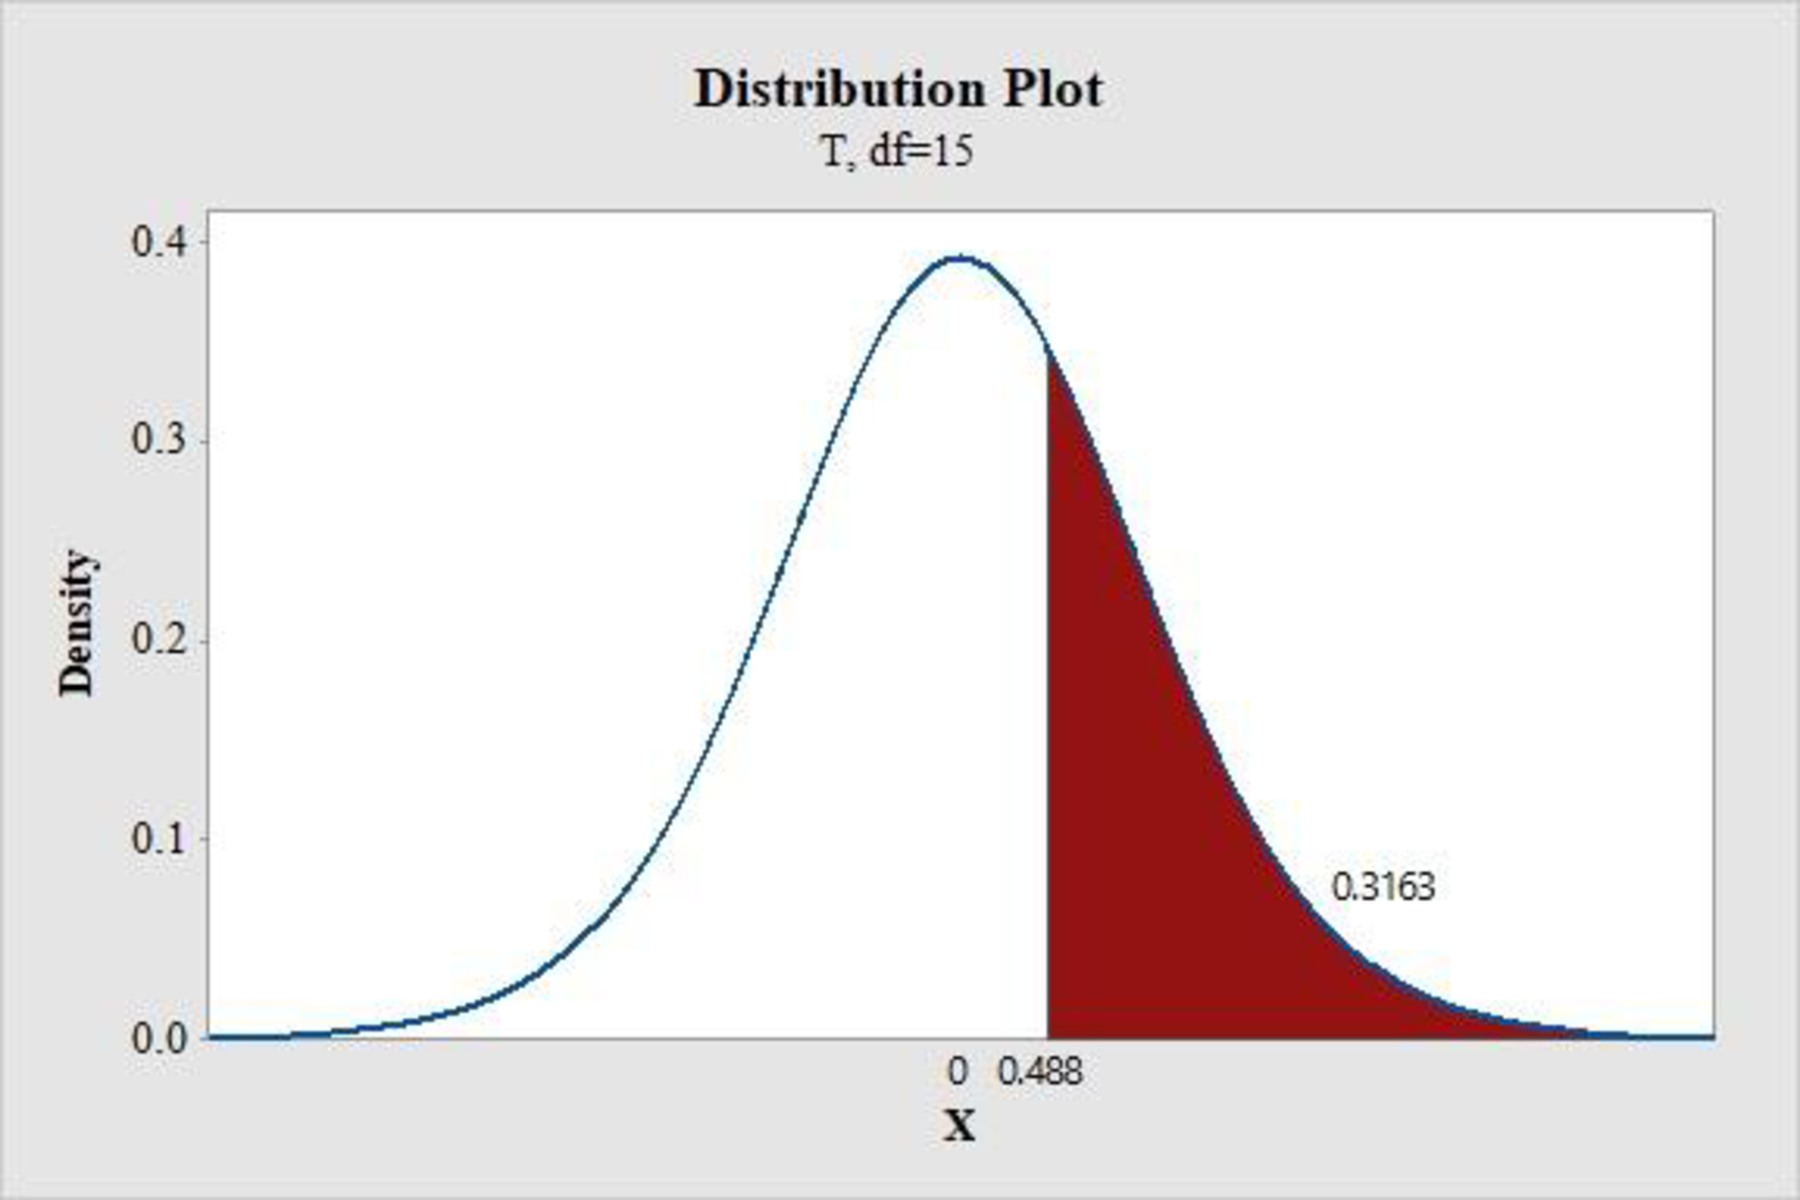
Thus,
P-value:
Thus, the p-value is 0.633.
9.
Rejection rule:
If
Conclusion:
The P-value is 0.633.
The level of significance is 0.1.
The P-value is greater than the level of significance.
That is,
Based on rejection rule, do not reject the null hypothesis.
Thus, there is no convincing evidence that the average decrease in percentage area associated with a 1-year age increase is not 0.5.
b.
Obtain an estimate of the average percentage area covered by pores for all 50-year olds in the population.
b.
Answer to Problem 61CR
The estimate of the average percentage area covered by pores for all 50-year olds in the population is between 47.05 and 54.08.
Explanation of Solution
Calculation:
The confidence interval for
From the MINITAB output in Part (a), the estimated linear regression line is
Point estimate:
The point estimate when the percentage area covered by pores for all 50-year olds in the population is calculated as follows.
Estimated standard deviation:
Substitute,
Critical value:
From the Appendix: Table 3 the t Critical Values:
- Locate the value 15 in the degrees of freedom (df) column.
- Locate the 0.95 in the row of central area captured.
- The intersecting value that corresponds to the df 15 with confidence level 0.95 is 2.13.
Thus, the critical value for
Substitute
Therefore, one can be 95% confident that the estimate of the average percentage area covered by pores for all 50-year olds in the population is between 47.05 and 54.08.
Want to see more full solutions like this?
Chapter 13 Solutions
Introduction To Statistics And Data Analysis


 Linear Algebra: A Modern IntroductionAlgebraISBN:9781285463247Author:David PoolePublisher:Cengage Learning
 Calculus For The Life SciencesCalculusISBN:9780321964038Author:GREENWELL, Raymond N., RITCHEY, Nathan P., Lial, Margaret L.Publisher:Pearson Addison Wesley,
 Glencoe Algebra 1, Student Edition, 9780079039897...AlgebraISBN:9780079039897Author:CarterPublisher:McGraw Hill
 Big Ideas Math A Bridge To Success Algebra 1: Stu...AlgebraISBN:9781680331141Author:HOUGHTON MIFFLIN HARCOURTPublisher:Houghton Mifflin Harcourt