
Introduction To Statistics And Data Analysis
6th Edition
ISBN: 9781337793612
Author: PECK, Roxy.
Publisher: Cengage Learning,
expand_more
expand_more
format_list_bulleted
Concept explainers
Videos
Textbook Question
Chapter 13.2, Problem 25E
Acrylamide is a chemical that is sometimes found in cooked starchy foods and which is thought to increase the risk of certain kinds of cancer. The paper “A Statistical Regression Model for the Estimation of Acrylamide Concentrations in French Fries for Excess Lifetime Cancer Risk Assessment” (Food and Chemical Toxicology [2012]: 3867–3876) describes a study to investigate the effect of trying time (in seconds) and acrylamide concentration (in micrograms per kilogram) in French fries. The data in the accompanying table are approximate values read from a graph that appeared in the paper.
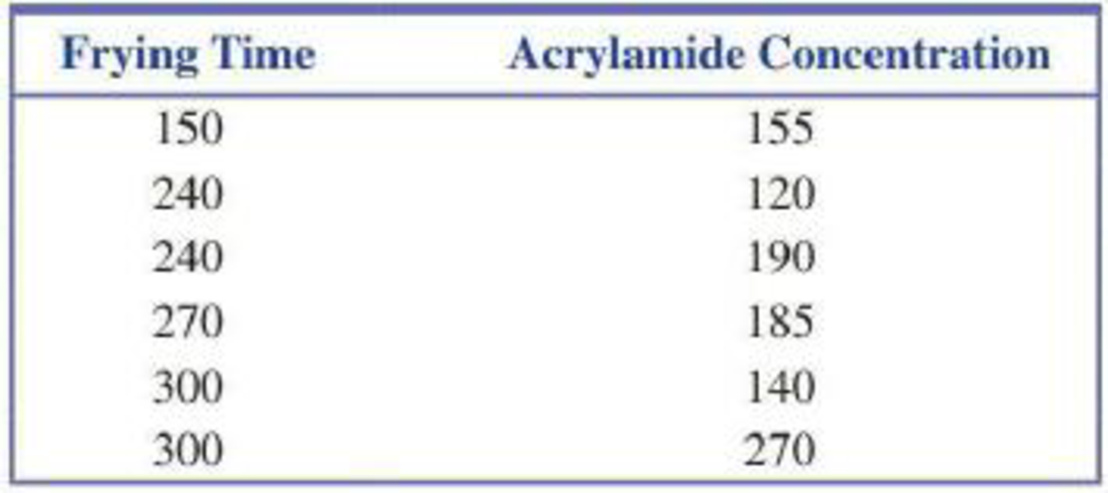
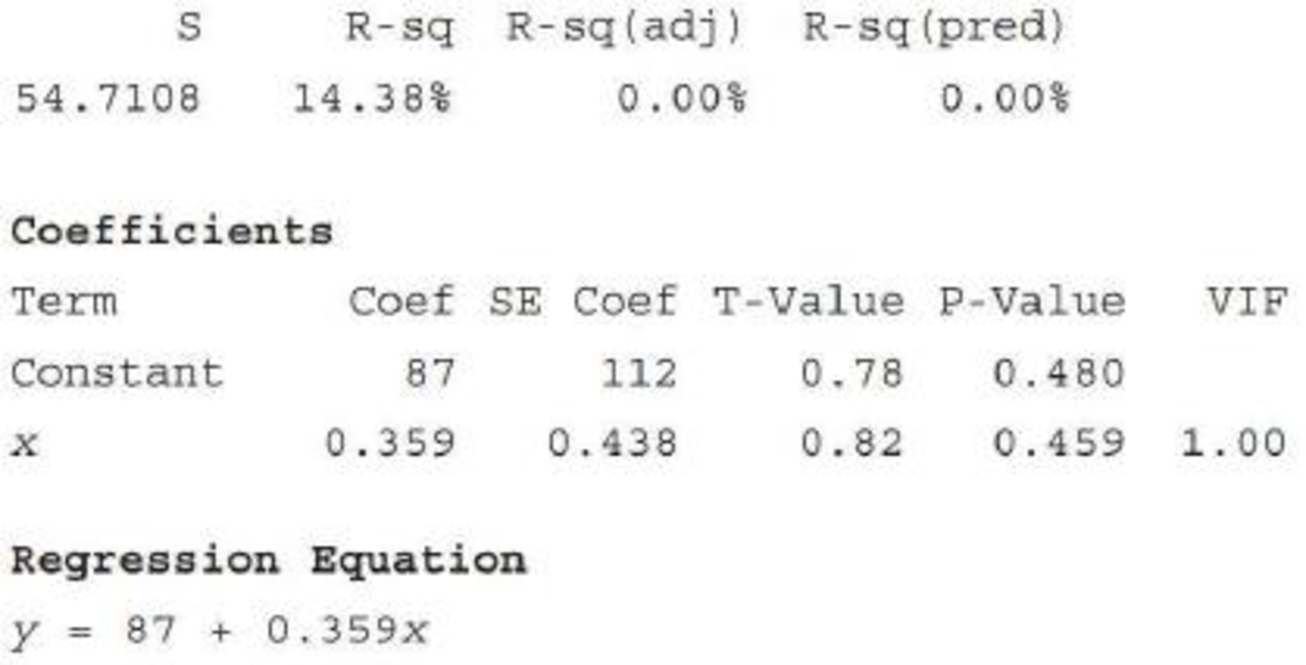
- a. For these data, the estimated regression line for predicting y = Acrylamide concentration based on x = Frying time is
- b. What would you predict for acrylamide concentration for a frying time of 250 seconds?
- c. Use the given Minitab output to decide if there is convincing evidence of a useful linear relationship between acrylamide concentration and frying temperature.
Expert Solution & Answer

Trending nowThis is a popular solution!

Students have asked these similar questions
Blood cocaine concentration (mg/L) was determinedboth for a sample of individuals who had died fromcocaine-induced excited delirium (ED) and for a sampleof those who had died from a cocaine overdose withoutexcited delirium; survival time for people in bothgroups was at most 6 hours. The accompanying datawas read from a comparative boxplot in the article“Fatal Excited Delirium Following Cocaine Use” (J.of Forensic Sciences, 1997: 25–31).
ED 0 0 0 0 .1 .1 .1 .1 .2 .2 .3 .3.3 .4 .5 .7 .8 1.0 1.5 2.7 2.83.5 4.0 8.9 9.2 11.7 21.0Non-ED 0 0 0 0 0 .1 .1 .1 .1 .2 .2 .2.3 .3 .3 .4 .5 .5 .6 .8 .9 1.01.2 1.4 1.5 1.7 2.0 3.2 3.5 4.14.3 4.8 5.0 5.6 5.9 6.0 6.4 7.98.3 8.7 9.1 9.6 9.9 11.0 11.512.2 12.7 14.0 16.6 17.8
a. Determine the medians, fourths, and fourth spreadsfor the two samples.b. Are there any outliers in either sample? Any extremeoutliers?c. Construct a comparative boxplot, and use it as abasis for comparing and contrasting the ED andnon-ED samples.
Are seatbelts effective at saving lives? We wish to examine whether or not the use of seatbelts reduces
fatalities at the a = 0.01 level of significance. Let pN represent the proportion of non-seatbelt wearing
passengers who were involved in a crash and died and py represent the proportion of seatbelt wearing
passengers who were involved in a crash and died.
NOTE: The data used in this study were obtained through observational study...no experiment was
conducted!
Which would be correct hypotheses for this test?
O Ho:PN = pY, H1:PN > pY
Ho: PN = pY, H,:PN Py
In a random sample of 321 non-seatbelt wearing passengers involved in a car crash, 30 were killed. In a
random sample of 492 seatbelt wearing passengers involved in a car crash, 13 were killed.
Find the test statistic (2 decimal places):
Give the P-value (4 decimal places - if less than 0.001 answer 0):
Which is the correct result:
Reject the Null Hypothesis
O Do not Reject the Null Hypothesis
Which would be the appropriate…
Foot ulcers are a common problem for people with diabetes. Higher skin temperatures on
the foot indicate an increased risk of ulcers. The article "An Intelligent Insole for Diabetic
Patients with the Loss of Protective Sensation" (Kimberly Anderson, M.S. Thesis, Colorado
School of Mines), reports measurements of temperatures, in °F, of both feet for 181
diabetic patients. The results are presented in the following table.
Left Foot
Right Foot
80
80
85
85
75
80
88
86
89
87
87
82
78
78
88
89
89
90
76
81
89
86
87
82
78
78
80
81
87
82
86
85
76
80
88
89
Construct a scatterplot of the right foot temperature (y) versus the left foot temperature
(x). Verify that a linear model is appropriate.
b.
Compute the least-squares line for predicting the right foot temperature from the left
foot temperature.
If the left foot temperatures of two patients differ by 2 degrees, by how much would
you predict their right foot temperatures to differ?
Predict the right foot temperature for a patient whose left…
Chapter 13 Solutions
Introduction To Statistics And Data Analysis
Ch. 13.1 - Let x be the size of a house (in square feet) and...Ch. 13.1 - Consider the variables and population regression...Ch. 13.1 - The flow rate in a device used for air quality...Ch. 13.1 - The paper Predicting Yolk Height, Yolk Width,...Ch. 13.1 - A sample of small cars was selected, and the...Ch. 13.1 - Prob. 6ECh. 13.1 - Suppose that a simple linear regression model is...Ch. 13.1 - a. Explain the difference between the line y x...Ch. 13.1 - Prob. 9ECh. 13.1 - Hormone replacement therapy (HRT) is thought to...
Ch. 13.1 - Consider the data and estimated regression line...Ch. 13.1 - A simple linear regression model was used to...Ch. 13.1 - Consider the accompanying data on x = Advertising...Ch. 13.2 - What is the difference between and b? What is the...Ch. 13.2 - The largest commercial fishing enterprise in the...Ch. 13.2 - Prob. 16ECh. 13.2 - Prob. 17ECh. 13.2 - Prob. 18ECh. 13.2 - An experiment to study the relationship between x...Ch. 13.2 - The paper The Effects of Split Keyboard Geometry...Ch. 13.2 - The authors of the paper Decreased Brain Volume in...Ch. 13.2 - Do taller adults make more money? The authors of...Ch. 13.2 - Researchers studying pleasant touch sensations...Ch. 13.2 - Prob. 24ECh. 13.2 - Acrylamide is a chemical that is sometimes found...Ch. 13.2 - Prob. 26ECh. 13.2 - Exercise 13.18 described a regression analysis...Ch. 13.2 - Consider the accompanying data on x = Research and...Ch. 13.2 - Prob. 29ECh. 13.2 - In anthropological studies, an important...Ch. 13.3 - The graphs accompanying this exercise are based on...Ch. 13.3 - Prob. 32ECh. 13.3 - Prob. 33ECh. 13.3 - The article Vital Dimensions in Volume Perception:...Ch. 13.3 - Prob. 35ECh. 13.3 - An investigation of the relationship between x =...Ch. 13.4 - Prob. 37ECh. 13.4 - Prob. 38ECh. 13.4 - In Exercise 13.19, we considered a regression of y...Ch. 13.4 - Prob. 40ECh. 13.4 - A subset of data read from a graph that appeared...Ch. 13.4 - Prob. 42ECh. 13.4 - Prob. 43ECh. 13.4 - The article first introduced in Exercise 13.34 of...Ch. 13.4 - The shelf life of packaged food depends on many...Ch. 13.4 - For the cereal data of the previous exercise, the...Ch. 13.4 - The article Performance Test Conducted for a Gas...Ch. 13.5 - Prob. 48ECh. 13.5 - Prob. 49ECh. 13.5 - A sample of n = 353 college faculty members was...Ch. 13.5 - Prob. 51ECh. 13.5 - Prob. 52ECh. 13.5 - The accompanying summary quantities for x =...Ch. 13.5 - Prob. 54ECh. 13.5 - Prob. 55ECh. 13.6 - Prob. 56ECh. 13 - Prob. 1CRECh. 13 - Prob. 2CRECh. 13 - Prob. 3CRECh. 13 - Prob. 4CRECh. 13 - Prob. 5CRECh. 13 - The accompanying graphical display is similar to...Ch. 13 - Prob. 7CRECh. 13 - Prob. 8CRECh. 13 - Consider the following data on y = Number of songs...Ch. 13 - Many people take ginkgo supplements advertised to...Ch. 13 - Prob. 11CRECh. 13 - Prob. 12CRECh. 13 - Prob. 13CRECh. 13 - Prob. 14CRECh. 13 - The discharge of industrial wastewater into rivers...Ch. 13 - Many people take ginkgo supplements advertised to...Ch. 13 - It is hypothesized that when homing pigeons are...Ch. 13 - Prob. 18CRECh. 13 - Prob. 57CRCh. 13 - Prob. 58CRCh. 13 - Prob. 59CRCh. 13 - The article Photocharge Effects in Dye Sensitized...Ch. 13 - Prob. 61CRCh. 13 - Prob. 62CRCh. 13 - Prob. 63CRCh. 13 - Prob. 64CRCh. 13 - Prob. 65CRCh. 13 - The article Improving Fermentation Productivity...Ch. 13 - Prob. 67CRCh. 13 - Prob. 68CRCh. 13 - Prob. 69CR
Knowledge Booster


Learn more about
Need a deep-dive on the concept behind this application? Look no further. Learn more about this topic, statistics and related others by exploring similar questions and additional content below.Similar questions
- A medical student at a community college in city Q wants to study the factors affecting the systolic blood pressure of a person (Y) Generally, the systolic blood pressure depends on the BMI of a person (B) and the age of the person A. She wants to test whether or not the BMI has a significant effect on the systolic blood pressure, keeping the age of the person constant. For her study, she collects a random sample of 125 patients from the city and estimates the following regression function: Y= 15.50 + 0..90B+1.15A. (0.55) (0 40) The test statistic of the study the student wants to conduct (Ho: B, = 0 vs. H, B, #0), keeping other variables constant is. (Round your answer to two decimal places.) At the 5% significance level, the student will ▼ the null hypothesis. Keeping BMIl constant, she now wants to test whether the age of a person (A) has no significant effect or a positive effect on the person's systolic blood pressure. So, the test statistic associated with the one-sided test the…arrow_forwardA researcher is using a panel data set on n = 1000 workers over T = 10 years (from 2001 through 2010) that contains the workers' earnings, gender, education, and age. The researcher is interested in the effect of education on earnings. Suppose you run a regression of earnings on person-specific and time-specific control variables. Can this regression be used to estimate the effect of gender on an individual's earnings or the effect of the national unemployment rate on an individual's earnings? A. Neither effect can be estimated using this regression. B. It can be used to estimate the effect of both gender and the national unemployment rate on an individual's earnings C. It can be used to estimate the effect of gender on an individual's earnings, but not the effect of the national unemployment rate on an individual's earnings. D. It can be used to estimate the effect of the national unemployment rate on an individual's earnings, but not the effect of gender on an individual's earnings.arrow_forwardIn a study of spot number in beetles, which have normally-distributed spot counts, you collect 46 beetles from the wild and count their spots. The average spot count is 8.7. You estimate the heritability using parent-offspring regression, which gives an estimate of 0.83. Then you split the population into two classes: those with 9 or more spots and those with 8 or fewer spots. The first group has an average of 11.3 spots and the second has an average of 6.8 spots. The offspring produced by the first group (the larger beetles) have an average of 10.78 spots. What is the expected mean of the second group?arrow_forward
- Acrylamide is a chemical that is sometimes found in cooked starchy foods and which is thought to increase the risk of certain kinds of cancer. The paper "A Statistical Regression Model for the Estimation of Acrylamide Concentrations in French Fries for Excess Lifetime Cancer Risk Assessment"+ describes a study to investigate the effect of frying time (in seconds) and acrylamide concentration (in micrograms per kilogram) in french fries. The data in the accompanying table are approximate values read from a graph that appeared in the paper. Frying Acrylamide Time Concentration 150 240 240 270 300 300 150 + 115 190 180 145 275 (a) Find the equation of the least-squares line for predicting acrylamide concentration using frying time. (Round your answers to four decimal places.) ŷ = (b) Does the equation of the least-squares line support the conclusion that longer frying times tend to be paired with higher acrylamide concentrations? Explain. No, the least squares regression line equation…arrow_forwardAcrylamide is a chemical that is sometimes found in cooked starchy foods and which is thought to increase the risk of certain kinds of cancer. The paper "A Statistical Regression Model for the Estimation of Acrylamide Concentrations in French Fries for Excess Lifetime Cancer Risk Assessment"+ describes a study to investigate the effect of frying time (in seconds) and acrylamide concentration (in micrograms per kilogram) in french fries. The data in the accompanying table are approximate values read from a graph that appeared in the paper. Frying Acrylamide Time Concentration 150 240 240 270 300 300 150 125 + 195 185 135 275 USE SALT (a) Find the equation of the least-squares line for predicting acrylamide concentration using frying time. (Round your answers to four decimal places.) ŷ = (b) Does the equation of the least-squares line support the conclusion that longer frying times tend to be paired with higher acrylamide concentrations? Explain. O No, the least squares regression line…arrow_forward
arrow_back_ios
arrow_forward_ios
Recommended textbooks for you
 Linear Algebra: A Modern IntroductionAlgebraISBN:9781285463247Author:David PoolePublisher:Cengage Learning
 Calculus For The Life SciencesCalculusISBN:9780321964038Author:GREENWELL, Raymond N., RITCHEY, Nathan P., Lial, Margaret L.Publisher:Pearson Addison Wesley,
 Glencoe Algebra 1, Student Edition, 9780079039897...AlgebraISBN:9780079039897Author:CarterPublisher:McGraw Hill
 Big Ideas Math A Bridge To Success Algebra 1: Stu...AlgebraISBN:9781680331141Author:HOUGHTON MIFFLIN HARCOURTPublisher:Houghton Mifflin Harcourt
Linear Algebra: A Modern Introduction
Algebra
ISBN:9781285463247
Author:David Poole
Publisher:Cengage Learning
Calculus For The Life Sciences
Calculus
ISBN:9780321964038
Author:GREENWELL, Raymond N., RITCHEY, Nathan P., Lial, Margaret L.
Publisher:Pearson Addison Wesley,
Glencoe Algebra 1, Student Edition, 9780079039897...
Algebra
ISBN:9780079039897
Author:Carter
Publisher:McGraw Hill
Big Ideas Math A Bridge To Success Algebra 1: Stu...
Algebra
ISBN:9781680331141
Author:HOUGHTON MIFFLIN HARCOURT
Publisher:Houghton Mifflin Harcourt
Correlation Vs Regression: Difference Between them with definition & Comparison Chart; Author: Key Differences;https://www.youtube.com/watch?v=Ou2QGSJVd0U;License: Standard YouTube License, CC-BY
Correlation and Regression: Concepts with Illustrative examples; Author: LEARN & APPLY : Lean and Six Sigma;https://www.youtube.com/watch?v=xTpHD5WLuoA;License: Standard YouTube License, CC-BY