
Introduction To Statistics And Data Analysis
6th Edition
ISBN: 9781337793612
Author: PECK, Roxy.
Publisher: Cengage Learning,
expand_more
expand_more
format_list_bulleted
Concept explainers
Videos
Textbook Question
Chapter 13.3, Problem 34E
The article “Vital Dimensions in Volume Perception: Can the Eye Fool the Stomach?” (Journal of Marketing Research [1999]: 313–326) gave the accompanying data on the dimensions of 27 representative food products (Gerber baby food, Cheez Whiz, Skippy Peanut Butter, and Ahmed’s tandoori paste, to name a few).
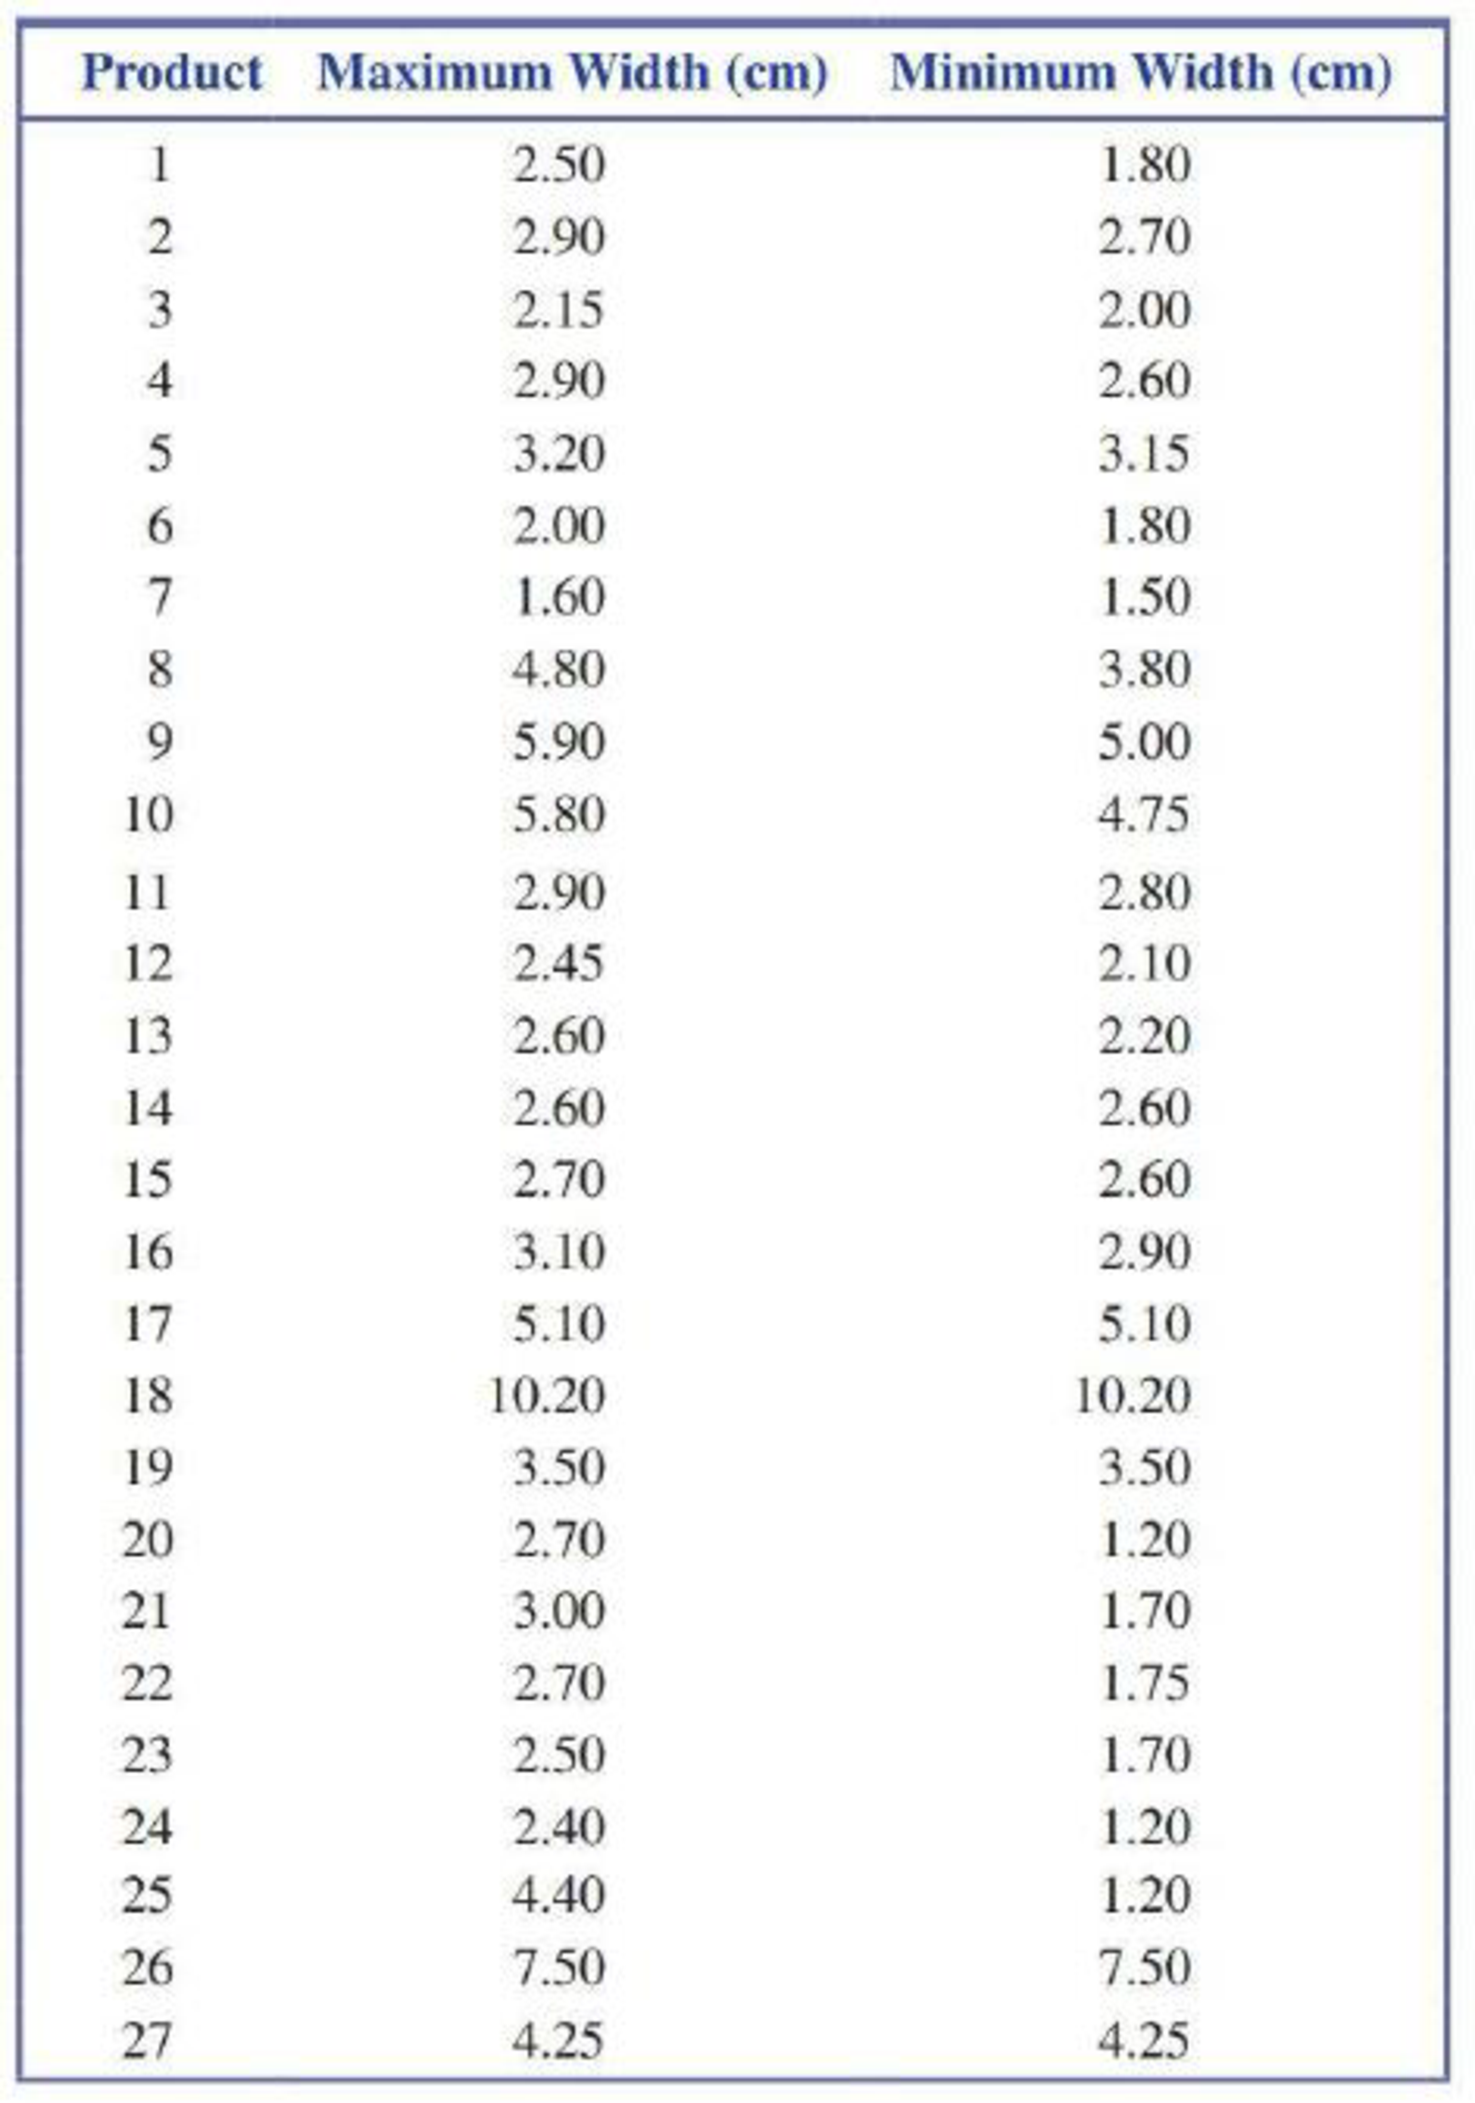
- a. Fit the simple linear regression model that would allow prediction of the maximum width of a food container based on its minimum width.
- b. Calculate the standardized residuals (or just the residuals if a computer program that doesn’t give standardized residuals is used) and make a residual plot to determine whether there are any outliers.
- c. The data point with the largest residual is for a 1-liter Coke bottle. Delete this data point and determine the equation of the regression line. Did deletion of this point result in a large change in the equation of the estimated regression line?
- d. For the regression line of Part (c), interpret the estimated slope and, if appropriate, the intercept.
- e. For the data set with the Coke bottle deleted, are the assumptions of the simple linear regression model reasonable? Give statistical evidence.
Expert Solution & Answer

Trending nowThis is a popular solution!

Students have asked these similar questions
An attempt was made to construct a regression model explaining student scores in intermediate economics courses (Waldauer, Duggal, and Williams 1992). The population regression model assumed thatY = total student score in intermediate economics coursesX1 = mathematics score on Scholastic Aptitude TestX2 = verbal score on Scholastic Aptitude TestX3 = grade in college algebra (A = 4, B = 3, C = 2, D = 1)X4 = grade in college principles of economics courseX5 = dummy variable taking the value 1 if the student is female and 0 if maleX6 = dummy variable taking the value 1 if the instructor is male and 0 if femaleX7 = dummy variable taking the value 1 if the student and instructor are the same gender and 0 otherwiseThis model was fitted to data on 262 students. Next we report t-ratios, so that tj is the ratio of the estimate of bj to its associated estimated standard error. These ratios are as follows:t1 = 4.69, t2 = 2.89, t3 = 0.46, t4 = 4.90,t5 = 0.13, t6 = -1.08, t7 = 0.88The objective of…
1. Regression methods were used to analyze the data from a study investigating the relationship between roadway surface temperature (x) and pavement deflection ( y). Summary quantities were n = 20, ∑ y i = 12.75, ∑ y i 2 = 8.86, ∑ x i = 1478, ∑ x i 2 = 143 , 215.80, and ∑ x i y i = 1083.67.
(a) Calculate the least squares estimates of the slope and intercept. Graph the regression line. with plotting of graph(b) Use the equation of the fitted line to predict what pavement deflection would be observed when the surface temperature is 85F.(c) What is the mean pavement deflection when the surface temperature is 90F?
The model developed from sample data that has the form of Yhat = bo +bjX is known as the multiple regression model
with two predictor variables. (True or False)
O True
O False
Chapter 13 Solutions
Introduction To Statistics And Data Analysis
Ch. 13.1 - Let x be the size of a house (in square feet) and...Ch. 13.1 - Consider the variables and population regression...Ch. 13.1 - The flow rate in a device used for air quality...Ch. 13.1 - The paper Predicting Yolk Height, Yolk Width,...Ch. 13.1 - A sample of small cars was selected, and the...Ch. 13.1 - Prob. 6ECh. 13.1 - Suppose that a simple linear regression model is...Ch. 13.1 - a. Explain the difference between the line y x...Ch. 13.1 - Prob. 9ECh. 13.1 - Hormone replacement therapy (HRT) is thought to...
Ch. 13.1 - Consider the data and estimated regression line...Ch. 13.1 - A simple linear regression model was used to...Ch. 13.1 - Consider the accompanying data on x = Advertising...Ch. 13.2 - What is the difference between and b? What is the...Ch. 13.2 - The largest commercial fishing enterprise in the...Ch. 13.2 - Prob. 16ECh. 13.2 - Prob. 17ECh. 13.2 - Prob. 18ECh. 13.2 - An experiment to study the relationship between x...Ch. 13.2 - The paper The Effects of Split Keyboard Geometry...Ch. 13.2 - The authors of the paper Decreased Brain Volume in...Ch. 13.2 - Do taller adults make more money? The authors of...Ch. 13.2 - Researchers studying pleasant touch sensations...Ch. 13.2 - Prob. 24ECh. 13.2 - Acrylamide is a chemical that is sometimes found...Ch. 13.2 - Prob. 26ECh. 13.2 - Exercise 13.18 described a regression analysis...Ch. 13.2 - Consider the accompanying data on x = Research and...Ch. 13.2 - Prob. 29ECh. 13.2 - In anthropological studies, an important...Ch. 13.3 - The graphs accompanying this exercise are based on...Ch. 13.3 - Prob. 32ECh. 13.3 - Prob. 33ECh. 13.3 - The article Vital Dimensions in Volume Perception:...Ch. 13.3 - Prob. 35ECh. 13.3 - An investigation of the relationship between x =...Ch. 13.4 - Prob. 37ECh. 13.4 - Prob. 38ECh. 13.4 - In Exercise 13.19, we considered a regression of y...Ch. 13.4 - Prob. 40ECh. 13.4 - A subset of data read from a graph that appeared...Ch. 13.4 - Prob. 42ECh. 13.4 - Prob. 43ECh. 13.4 - The article first introduced in Exercise 13.34 of...Ch. 13.4 - The shelf life of packaged food depends on many...Ch. 13.4 - For the cereal data of the previous exercise, the...Ch. 13.4 - The article Performance Test Conducted for a Gas...Ch. 13.5 - Prob. 48ECh. 13.5 - Prob. 49ECh. 13.5 - A sample of n = 353 college faculty members was...Ch. 13.5 - Prob. 51ECh. 13.5 - Prob. 52ECh. 13.5 - The accompanying summary quantities for x =...Ch. 13.5 - Prob. 54ECh. 13.5 - Prob. 55ECh. 13.6 - Prob. 56ECh. 13 - Prob. 1CRECh. 13 - Prob. 2CRECh. 13 - Prob. 3CRECh. 13 - Prob. 4CRECh. 13 - Prob. 5CRECh. 13 - The accompanying graphical display is similar to...Ch. 13 - Prob. 7CRECh. 13 - Prob. 8CRECh. 13 - Consider the following data on y = Number of songs...Ch. 13 - Many people take ginkgo supplements advertised to...Ch. 13 - Prob. 11CRECh. 13 - Prob. 12CRECh. 13 - Prob. 13CRECh. 13 - Prob. 14CRECh. 13 - The discharge of industrial wastewater into rivers...Ch. 13 - Many people take ginkgo supplements advertised to...Ch. 13 - It is hypothesized that when homing pigeons are...Ch. 13 - Prob. 18CRECh. 13 - Prob. 57CRCh. 13 - Prob. 58CRCh. 13 - Prob. 59CRCh. 13 - The article Photocharge Effects in Dye Sensitized...Ch. 13 - Prob. 61CRCh. 13 - Prob. 62CRCh. 13 - Prob. 63CRCh. 13 - Prob. 64CRCh. 13 - Prob. 65CRCh. 13 - The article Improving Fermentation Productivity...Ch. 13 - Prob. 67CRCh. 13 - Prob. 68CRCh. 13 - Prob. 69CR
Knowledge Booster


Learn more about
Need a deep-dive on the concept behind this application? Look no further. Learn more about this topic, statistics and related others by exploring similar questions and additional content below.Similar questions
- For the following table of data. x 1 2 3 4 5 6 7 8 9 10 y 0 0.5 1 2 2.5 3 3 4 4.5 5 a. draw a scatterplot. b. calculate the correlation coefficient. c. calculate the least squares line and graph it on the scatterplot. d. predict the y value when x is 11.arrow_forwardIn a study of housing demand, the county assessor is interested in developing a regression model to estimate the market value (i.e., selling price) of residential property within his jurisdiction. The assessor feels that the most important variable affecting selling price (measured in thousands of dollars) is the size of house (measured in hundreds of square feet). He randomly selected 15 houses and measured both the selling price and size, as shown in the following table. OBSERVATIONi SELLING PRICE (× $1,000)Y SIZE (× 100 ft2 )X 1 2 3 4 5 6 7 8 9 10 11 12 13 14 15 265.2 279.6 311.2 328.0 352.0 281.2 288.4 292.8 356.0 263.2 272.4 291.2 299.6 307.6 320.4 12.0 20.2 27.0 30.0 30.0 21.4 21.6 25.2 37.2 14.4 15.0 22.4 23.9 26.6 30.7 a. Plot the data.b. Determine the estimated regression line. Give an economic interpretation of the estimated slope (b) coefficient.c. Determine if size is a statistically significant variable in estimating selling price.d. Calculate the coefficient…arrow_forward2. A botanist is willing to understand the relation between volume, girth and height of black cherry trees. To this end, she collects data that is presented in trees table of the datasets library. Build a predictive multiple linear regression model for volume using girth and height as independent variables. a. What does the F-test tell about the model? Explain the result using the null hypothesis of the test. b. Provide confidence and prediction intervals for a black cherry tree with 10 inch of girth and 82 feet tall.arrow_forward
- The rental of an apartment (R) near campus is a function of the square footage (Sq). A random sample of apartments near campus yielded the following summary statistics: R= $350, Sq = 100, sR = $ 30, and 8 są = 10. Suppose also that the correlation between price and weight is 0.8. (a) Write the implied least squares linear regression equation. (b) Suppose an apartment has 75 sqft. Predict its price based on the above model. (c) Suppose the true rental of the apartment in part (b) is $ 325. What is the value of the residual?arrow_forwardWe have data on Lung Capacity of persons and we wish to build a multiple linear regression model that predicts Lung Capacity based on the predictors Age and Smoking Status. Age is a numeric variable whereas Smoke is a categorical variable (0 if non-smoker, 1 if smoker). Here is the partial result from STATISTICA. b* Std.Err. of b* Std.Err. N=725 of b Intercept Age Smoke 0.835543 -0.075120 1.085725 0.555396 0.182989 0.014378 0.021631 0.021631 -0.648588 0.186761 Which of the following statements is absolutely false? A. The expected lung capacity of a smoker is expected to be 0.648588 lower than that of a non-smoker. B. The predictor variables Age and Smoker both contribute significantly to the model. C. For every one year that a person gets older, the lung capacity is expected to increase by 0.555396 units, holding smoker status constant. D. For every one unit increase in smoker status, lung capacity is expected to decrease by 0.648588 units, holding age constant.arrow_forwardChicken Chicken sandwiches are often advertisedas a healthier alternative to beef because many are lower in fat. Data from tests on 15 different sand-wiches randomly selected from the website http:// fast-food-nutrition.findthebest.com/d/a/Chicken-Sandwich produced the Calories vs. Fat scatterplot and the regression analysis below. a) Do you think a linear model is appropriate in thissituation?b) Describe the strength of this association.c) Write the equation of the regression line to estimatecalories from the fat content.d) Explain the meaning of the slope.e) Explain the meaning of the y-intercept. f) What does it mean if a certain sandwich has a nega-tive residual?arrow_forward
arrow_back_ios
arrow_forward_ios
Recommended textbooks for you

 Linear Algebra: A Modern IntroductionAlgebraISBN:9781285463247Author:David PoolePublisher:Cengage Learning
 Calculus For The Life SciencesCalculusISBN:9780321964038Author:GREENWELL, Raymond N., RITCHEY, Nathan P., Lial, Margaret L.Publisher:Pearson Addison Wesley,
 Algebra & Trigonometry with Analytic GeometryAlgebraISBN:9781133382119Author:SwokowskiPublisher:Cengage
 Big Ideas Math A Bridge To Success Algebra 1: Stu...AlgebraISBN:9781680331141Author:HOUGHTON MIFFLIN HARCOURTPublisher:Houghton Mifflin Harcourt
Linear Algebra: A Modern Introduction
Algebra
ISBN:9781285463247
Author:David Poole
Publisher:Cengage Learning
Calculus For The Life Sciences
Calculus
ISBN:9780321964038
Author:GREENWELL, Raymond N., RITCHEY, Nathan P., Lial, Margaret L.
Publisher:Pearson Addison Wesley,
Algebra & Trigonometry with Analytic Geometry
Algebra
ISBN:9781133382119
Author:Swokowski
Publisher:Cengage
Big Ideas Math A Bridge To Success Algebra 1: Stu...
Algebra
ISBN:9781680331141
Author:HOUGHTON MIFFLIN HARCOURT
Publisher:Houghton Mifflin Harcourt
Correlation Vs Regression: Difference Between them with definition & Comparison Chart; Author: Key Differences;https://www.youtube.com/watch?v=Ou2QGSJVd0U;License: Standard YouTube License, CC-BY
Correlation and Regression: Concepts with Illustrative examples; Author: LEARN & APPLY : Lean and Six Sigma;https://www.youtube.com/watch?v=xTpHD5WLuoA;License: Standard YouTube License, CC-BY