
Introduction To Statistics And Data Analysis
6th Edition
ISBN: 9781337793612
Author: PECK, Roxy.
Publisher: Cengage Learning,
expand_more
expand_more
format_list_bulleted
Concept explainers
Videos
Textbook Question
Chapter 13.1, Problem 10E
Hormone replacement therapy (HRT) is thought to increase the risk of breast cancer. The accompanying data on
x = Percent of women using HRT
and
y = Breast cancer incidence (cases per 100,000 women) for a region in Germany for 5 years appeared in the paper “Decline in Breast Cancer Incidence after Decrease in Utilisation of Hormone Replacement Therapy” (Epidemiology [2008]: 427–430). The authors of the paper used a simple linear regression model to describe the relationship between HRT use and breast cancer incidence.
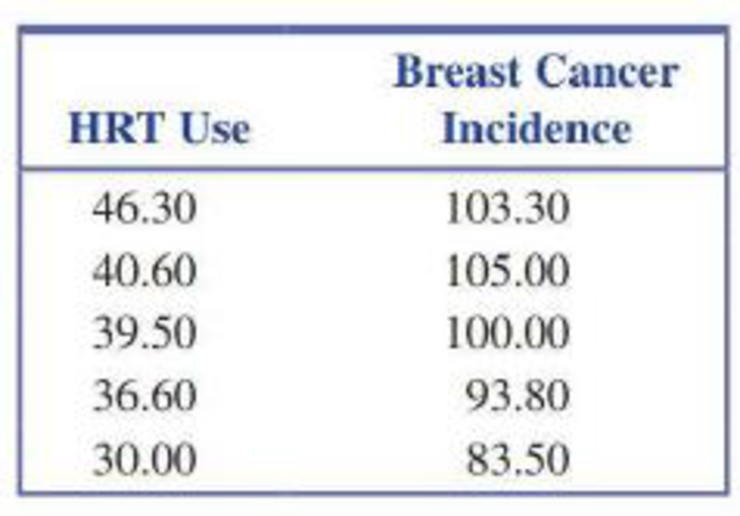
- a. What is the equation of the estimated regression line?
- b. What is the estimated average change in breast cancer incidence associated with a 1 percentage point increase in HRT use?
- c. What breast cancer incidence would be predicted in a year when HRT use was 40%?
- d. Should this regression model be used to predict breast cancer incidence for a year when HRT use was 20%? Explain.
Expert Solution & Answer

Trending nowThis is a popular solution!

Students have asked these similar questions
Hormone replacement therapy (HRT) is thought to increase the risk of breast cancer. The accompanying data on x = percent of women using HRT and y = breast cancer incidence (cases per 100,000 women) for a region in Germany for 5 years appeared in the
paper "Decline in Breast Cancer Incidence after Decrease in Utilization of Hormone Replacement Therapy." The authors of the paper used a simple linear regression model to describe the relationship between HRT use and breast cancer incidence.
HRT Use
Breast Cancer Incidence
46.30
103.30
40.60
105.00
39.50
100.00
36.60
93.80
30.00
83.50
n USE SALT
(a) What is the equation of the estimated regression line? (Round your numerical values to four decimal places.)
ý =
(b) What is the estimated average change in breast cancer incidence (in cases per 100,000 women) associated with a 1 percentage point increase in HRT use? (Round your answer to four decimal places.)
cases per 100,000 women
(c) What breast cancer incidence (in cases per 100,000 women)…
Hormone replacement therapy (HRT) is thought to increase the risk of breast cancer. The accompanying data on x = percent of women using HRT and y = breast cancer incidence (cases per
100,000 women) for a region in Germany for 5 years appeared in the paper "Decline in Breast Cancer Incidence after Decrease in Utilization of Hormone Replacement Therapy." The authors of the paper
used a simple linear regression model to describe the relationship between HRT use and breast cancer incidence.
t
HRT Use Breast Cancer Incidence
46.30
40.60
39.50
36.60
30.00
103.30
105.00
100.00
93.80
83.50
(a) What is the equation of the estimated regression line? (Round your numerical values to four decimal places.)
ŷ =
(b) What is the estimated average change in breast cancer incidence (in cases per 100,000 women) associated with a 1 percentage point increase in HRT use? (Round your answer to four decimal
places.)
cases per 100,000 women
(c) What breast cancer incidence (in cases per 100,000 women) would be…
Hormone replacement therapy (HRT) is thought to increase the risk of breast cancer. The accompanying data on x = percent of women using HRT and y = breast cancer incidence (cases per 100,000 women) for a region in Germany for 5 years appeared in the paper "Decline in Breast Cancer Incidence
after Decrease in Utilization of Hormone Replacement Therapy." The authors of the paper used a simple linear regression model to describe the relationship between HRT use and breast cancer incidence.
HRT Use
Breast Cancer Incidence
46.30
103.30
40.60
105.00
39.50
100.00
36.60
93.80
30.00
83.50
n USE SALT
(a) What is the equation of the estimated regression line? (Round your numerical values to four decimal places.)
ý = 45.5727 + (1.3354 )x
(b) What is the estimated average change in breast cancer incidence (in cases per 100,000 women) associated with a 1 percentage point increase in HRT use? (Round your answer to four decimal places.)
1.3354
cases per 100,000 women
(c) What breast cancer incidence…
Chapter 13 Solutions
Introduction To Statistics And Data Analysis
Ch. 13.1 - Let x be the size of a house (in square feet) and...Ch. 13.1 - Consider the variables and population regression...Ch. 13.1 - The flow rate in a device used for air quality...Ch. 13.1 - The paper Predicting Yolk Height, Yolk Width,...Ch. 13.1 - A sample of small cars was selected, and the...Ch. 13.1 - Prob. 6ECh. 13.1 - Suppose that a simple linear regression model is...Ch. 13.1 - a. Explain the difference between the line y x...Ch. 13.1 - Prob. 9ECh. 13.1 - Hormone replacement therapy (HRT) is thought to...
Ch. 13.1 - Consider the data and estimated regression line...Ch. 13.1 - A simple linear regression model was used to...Ch. 13.1 - Consider the accompanying data on x = Advertising...Ch. 13.2 - What is the difference between and b? What is the...Ch. 13.2 - The largest commercial fishing enterprise in the...Ch. 13.2 - Prob. 16ECh. 13.2 - Prob. 17ECh. 13.2 - Prob. 18ECh. 13.2 - An experiment to study the relationship between x...Ch. 13.2 - The paper The Effects of Split Keyboard Geometry...Ch. 13.2 - The authors of the paper Decreased Brain Volume in...Ch. 13.2 - Do taller adults make more money? The authors of...Ch. 13.2 - Researchers studying pleasant touch sensations...Ch. 13.2 - Prob. 24ECh. 13.2 - Acrylamide is a chemical that is sometimes found...Ch. 13.2 - Prob. 26ECh. 13.2 - Exercise 13.18 described a regression analysis...Ch. 13.2 - Consider the accompanying data on x = Research and...Ch. 13.2 - Prob. 29ECh. 13.2 - In anthropological studies, an important...Ch. 13.3 - The graphs accompanying this exercise are based on...Ch. 13.3 - Prob. 32ECh. 13.3 - Prob. 33ECh. 13.3 - The article Vital Dimensions in Volume Perception:...Ch. 13.3 - Prob. 35ECh. 13.3 - An investigation of the relationship between x =...Ch. 13.4 - Prob. 37ECh. 13.4 - Prob. 38ECh. 13.4 - In Exercise 13.19, we considered a regression of y...Ch. 13.4 - Prob. 40ECh. 13.4 - A subset of data read from a graph that appeared...Ch. 13.4 - Prob. 42ECh. 13.4 - Prob. 43ECh. 13.4 - The article first introduced in Exercise 13.34 of...Ch. 13.4 - The shelf life of packaged food depends on many...Ch. 13.4 - For the cereal data of the previous exercise, the...Ch. 13.4 - The article Performance Test Conducted for a Gas...Ch. 13.5 - Prob. 48ECh. 13.5 - Prob. 49ECh. 13.5 - A sample of n = 353 college faculty members was...Ch. 13.5 - Prob. 51ECh. 13.5 - Prob. 52ECh. 13.5 - The accompanying summary quantities for x =...Ch. 13.5 - Prob. 54ECh. 13.5 - Prob. 55ECh. 13.6 - Prob. 56ECh. 13 - Prob. 1CRECh. 13 - Prob. 2CRECh. 13 - Prob. 3CRECh. 13 - Prob. 4CRECh. 13 - Prob. 5CRECh. 13 - The accompanying graphical display is similar to...Ch. 13 - Prob. 7CRECh. 13 - Prob. 8CRECh. 13 - Consider the following data on y = Number of songs...Ch. 13 - Many people take ginkgo supplements advertised to...Ch. 13 - Prob. 11CRECh. 13 - Prob. 12CRECh. 13 - Prob. 13CRECh. 13 - Prob. 14CRECh. 13 - The discharge of industrial wastewater into rivers...Ch. 13 - Many people take ginkgo supplements advertised to...Ch. 13 - It is hypothesized that when homing pigeons are...Ch. 13 - Prob. 18CRECh. 13 - Prob. 57CRCh. 13 - Prob. 58CRCh. 13 - Prob. 59CRCh. 13 - The article Photocharge Effects in Dye Sensitized...Ch. 13 - Prob. 61CRCh. 13 - Prob. 62CRCh. 13 - Prob. 63CRCh. 13 - Prob. 64CRCh. 13 - Prob. 65CRCh. 13 - The article Improving Fermentation Productivity...Ch. 13 - Prob. 67CRCh. 13 - Prob. 68CRCh. 13 - Prob. 69CR
Knowledge Booster


Learn more about
Need a deep-dive on the concept behind this application? Look no further. Learn more about this topic, statistics and related others by exploring similar questions and additional content below.Similar questions
- Olympic Pole Vault The graph in Figure 7 indicates that in recent years the winning Olympic men’s pole vault height has fallen below the value predicted by the regression line in Example 2. This might have occurred because when the pole vault was a new event there was much room for improvement in vaulters’ performances, whereas now even the best training can produce only incremental advances. Let’s see whether concentrating on more recent results gives a better predictor of future records. (a) Use the data in Table 2 (page 176) to complete the table of winning pole vault heights shown in the margin. (Note that we are using x=0 to correspond to the year 1972, where this restricted data set begins.) (b) Find the regression line for the data in part ‚(a). (c) Plot the data and the regression line on the same axes. Does the regression line seem to provide a good model for the data? (d) What does the regression line predict as the winning pole vault height for the 2012 Olympics? Compare this predicted value to the actual 2012 winning height of 5.97 m, as described on page 177. Has this new regression line provided a better prediction than the line in Example 2?arrow_forwardHormone replacement therapy (HRT) is thought to increase the risk of breast cancer. The accompanying data on x = percent of women using HRT and y = breast cancer incidence (cases per 100,000 women) for a region in Germany for 5 years appeared in the paper "Decline in Breast Cancer Incidence after Decrease in Utilization of Hormone Replacement Therapy." The authors of the paper used a simple linear regression model to describe the relationship between HRT use and breast cancer incidence. + ŷ = HRT Use Breast Cancer Incidence 46.30 40.60 39.50 36.60 30.00 USE SALT 103.30 105.00 100.00 93.80 83.50 (a) What is the equation of the estimated regression line? (Round your numerical values to four decimal places.) (b) What is the estimated average change in breast cancer incidence (in cases per 100,000 women) associated with a 1 percentage point increase in HRT use? (Round your answer to four decimal places.) cases per 100,000 women (c) What breast cancer incidence (in cases per 100,000 women)…arrow_forwardOn May 25, 2010, LiveScience published an article titled "Simple Memory Test Predicts Intelligence." The article summarized a study that found that the score on a test of working memory capacity was correlated with a number of different measures of intelligence. One measure was cognitive functioning score. Suppose that one such linear regression for working memory capacity and cognitive functioning score from a sample of 12 people is ŷ = 6.2 + 26.7x, where y is the cognitive functioning score and x is the working memory score. (a) In a hypothesis test for the slope of the linear regression, which of the following would be the correct alternative hypothesis? Ha: ? = 0 Ha: ? > 26.7 Ha: ? ≠ 0 Ha: ? < 26.7 (b) Given the standard error of the slope, 5.2, calculate the test statistic. (Round your answer to four decimal places.) (c) Calculate the P-value and determine which conclusion is correct for the hypothesis test based on ? = 0.05. (Use technology.) We…arrow_forward
- Acrylamide is a chemical that is sometimes found in cooked starchy foods and which is thought to increase the risk of certain kinds of cancer. The paper "A Statistical Regression Model for the Estimation of Acrylamide Concentrations in French Fries for Excess Lifetime Cancer Risk Assessment"+ describes a study to investigate the effect of frying time (in seconds) and acrylamide concentration (in micrograms per kilogram) in french fries. The data in the accompanying table are approximate values read from a graph that appeared in the paper. Frying Acrylamide Time Concentration 150 240 240 270 300 300 150 125 + 195 185 135 275 USE SALT (a) Find the equation of the least-squares line for predicting acrylamide concentration using frying time. (Round your answers to four decimal places.) ŷ = (b) Does the equation of the least-squares line support the conclusion that longer frying times tend to be paired with higher acrylamide concentrations? Explain. O No, the least squares regression line…arrow_forwardA study was conducted on 64 female college athletes. The researcher collected data on a number of variables including percent body fat, total body weight, height, and age of athlete. The researcher wondered if % body fat (%BF), height (HGT), and/or age are significant predictors of total body weight. All conditions have been checked and are met and no transformations were needed. The technology output from the multiple regression analysis is given below. What percent of the variation in total body weight is being explained by the regression model with these three explanatory variables?arrow_forwardAcrylamide is a chemical that is sometimes found in cooked starchy foods and which is thought to increase the risk of certain kinds of cancer. The paper "A Statistical Regression Model for the Estimation of Acrylamide Concentrations in French Fries for Excess Lifetime Cancer Risk Assessment"+ describes a study to investigate the effect of frying time (in seconds) and acrylamide concentration (in micrograms per kilogram) in french fries. The data in the accompanying table are approximate values read from a graph that appeared in the paper. Frying Acrylamide Time Concentration 150 240 240 270 300 300 150 + 115 190 180 145 275 (a) Find the equation of the least-squares line for predicting acrylamide concentration using frying time. (Round your answers to four decimal places.) ŷ = (b) Does the equation of the least-squares line support the conclusion that longer frying times tend to be paired with higher acrylamide concentrations? Explain. No, the least squares regression line equation…arrow_forward
- A 10-year study conducted by the American Heart Association provided data on how age, blood pressure, and smoking relate to the risk of strokes (Dataset "Stroke"). Risk is interpreted as the probability (times 100) that a person will have a stroke over the next 10-year period. For the smoker variable, 1 indicates a smoker and 0 indicates a nonsmoker. a. Develop an estimated regression equation that can be used to predict the risk of stroke given the age and blood-pressure level. b. Consider adding two independent variables to the model developed in part (a), one for the interaction between age and blood-pressure level and the other for whether the person is a smoker. Develop an estimated regression equation using these four independent variables. c. At a 0.05 level of significance, test to see whether the addition of the interaction term and the smoker variable contributes significantly to the estimated regression equation developed in part (a). d. Refer to the model developed in part…arrow_forwardHormone replacement therapy (HRT) is thought to increase the risk of breast cancer. The accompanying data on x = percent of women using HRT and y = breast cancer incidence (cases per 100,000 women) for a region in Germany for 5 years appeared in the paper "Decline in Breast Cancer Incidence after Decrease in Utilization of Hormone Replacement Therapy." The authors of the paper used a simple linear regression model to describe the relationship between HRT use and breast cancer incidence. † HRT Use Breast Cancer Incidence 46.30 103.30 40.60 105.00 39.50 100.00 36.60 93.80 30.00 83.50 (a) What is the equation of the estimated regression line? (Round your numerical values to four decimal places.) ŷ = (b) What is the estimated average change in breast cancer incidence (in cases per 100,000 women) associated with a 1 percentage point increase in HRT use? (Round your answer to four decimal places.) cases per 100,000 women (c) What breast cancer…arrow_forwardIn an attempt to develop a model of wine quality as judged by wine experts, data on alcohol content and wine quality was collected from variants of a particular wine. From a sample of 17 wines, a model was created using the percentages of alcohol to predict wine quality. From the results of that regression, b1=0.4386 and Sb1=0.1141. a. At the 0.05 level of significance, is there evidence of a linear relationship between the percentage of alcohol and wine quality? b. Construct a 95% confidence interval estimate of the population slope, β1. b. The 95% confidence interval is __ ≤ β1 ≤ __ (Round to three decimal places as needed.)arrow_forward
- The administration of a midwestern university commissioned a salary equity study to help establish benchmarks for faculty salaries. The administration utilized the following regression model for annual salary, y : ?(?) β0+β1x ,where ?=0 if lecturer, 1 if assistant professor, 2 if associate professor, and 3 if full professor. The administration wanted to use the model to compare the mean salaries of professors in the different ranks. a) Explain the flaw in the model. b)Propose an alternative model that will achieve the administration’s objective. c) If the global F-test for the model you proposed in 2 is conducted, what would be the value of the numerator degrees of freedom?arrow_forwardA company randomly samples 48 months of monthly output and monthly total cost data. The sampled data will be used to develop a total cost curve for the company. The company believes that its monthly total cost depends, to a large extent on its monthly output, and hopes that a simple linear regression model will be useful in analyzing how total costs vary as monthly output varies. The company proposes the following model: Total Cost = Fixed Cost + Variable Cost per Unit *Monthly Output. Recall that fixed costs do not vary with the level of monthly output, while the variable cost per unit describes the change in total costs when monthly output changes by one unit. Regression Statistics Standard Error| 64.252 Observations 48 ANOVA df SS MS Regression 1 3097160 3097160 Residual 46 189904 4128 Total 47 3287064 Standard Error Coefficients I Stat Intercept 38.25 24.28 1.6 Monthly Output 19.69 0.72 27.4 A statistician has been asked by the company to conduct a statistical test to determine if…arrow_forwardThe number of pounds of steam used per month by a chemical plant is thought to be related to the average ambient temperature (in F) for that month. The past year’s usage and temperatures are in the following table: Assuming that a simple linear regression model is appropriate, fit the regression model relating stem usage (y) to the average temperature (x). What is the estimate of Sigma2? What is the estimate of expected stem usage when the average temperature is 55 F? What change in mean stem usage is expected when the monthly average temperature changes by 1 F? Suppose that the monthly average temperature is 47 F. Calculate the fitted value of y and the corresponding residual. Test for significance of regression using α=0.01 (Use ANOVA). Calculate the r2 of the model. Find a 99% CI for B1 .arrow_forward
arrow_back_ios
SEE MORE QUESTIONS
arrow_forward_ios
Recommended textbooks for you
 College AlgebraAlgebraISBN:9781305115545Author:James Stewart, Lothar Redlin, Saleem WatsonPublisher:Cengage Learning
 Calculus For The Life SciencesCalculusISBN:9780321964038Author:GREENWELL, Raymond N., RITCHEY, Nathan P., Lial, Margaret L.Publisher:Pearson Addison Wesley,
 Glencoe Algebra 1, Student Edition, 9780079039897...AlgebraISBN:9780079039897Author:CarterPublisher:McGraw Hill
 Big Ideas Math A Bridge To Success Algebra 1: Stu...AlgebraISBN:9781680331141Author:HOUGHTON MIFFLIN HARCOURTPublisher:Houghton Mifflin Harcourt
College Algebra
Algebra
ISBN:9781305115545
Author:James Stewart, Lothar Redlin, Saleem Watson
Publisher:Cengage Learning
Calculus For The Life Sciences
Calculus
ISBN:9780321964038
Author:GREENWELL, Raymond N., RITCHEY, Nathan P., Lial, Margaret L.
Publisher:Pearson Addison Wesley,
Glencoe Algebra 1, Student Edition, 9780079039897...
Algebra
ISBN:9780079039897
Author:Carter
Publisher:McGraw Hill
Big Ideas Math A Bridge To Success Algebra 1: Stu...
Algebra
ISBN:9781680331141
Author:HOUGHTON MIFFLIN HARCOURT
Publisher:Houghton Mifflin Harcourt
Correlation Vs Regression: Difference Between them with definition & Comparison Chart; Author: Key Differences;https://www.youtube.com/watch?v=Ou2QGSJVd0U;License: Standard YouTube License, CC-BY
Correlation and Regression: Concepts with Illustrative examples; Author: LEARN & APPLY : Lean and Six Sigma;https://www.youtube.com/watch?v=xTpHD5WLuoA;License: Standard YouTube License, CC-BY