
Introduction To Statistics And Data Analysis
6th Edition
ISBN: 9781337793612
Author: PECK, Roxy.
Publisher: Cengage Learning,
expand_more
expand_more
format_list_bulleted
Concept explainers
Videos
Textbook Question
Chapter 13, Problem 15CRE
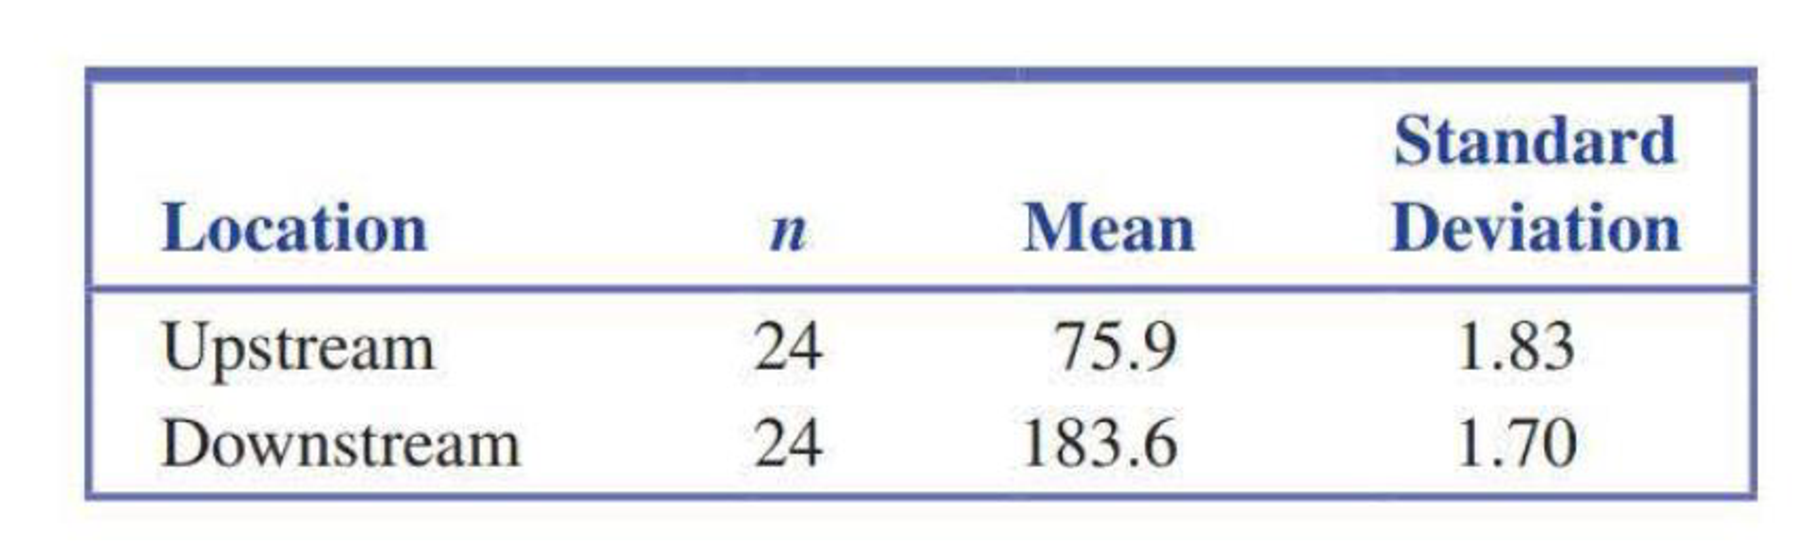
The discharge of industrial wastewater into rivers affects water quality. To assess the effect of a particular power plant on water quality, 24 water specimens were taken 16 km upstream and 4 km downstream of the plant. Alkalinity (mg/L) was determined for each specimen, resulting in the summary quantities in the accompanying table. Do the data suggest that the actual mean alkalinity is higher downstream than upstream by more than 50 mg/L? Use a 0.05 significance level.
Expert Solution & Answer

Trending nowThis is a popular solution!

Students have asked these similar questions
When exposed to an infection, a person typically develops antibodies. The extent to which theantibodies respond can be measured by looking at a persons titer, which is a measure of the number of antibodies present. The higher the titer is, the more antibodies that are present. The data in Table represent the titers of 11 ill people and 11 healthy people exposed to the tularemia virus in Vermont. Is the level of titer in the ill group greater than the level of titer in the healthy group? Use the α = 0.10 level of significance.
High cholesterol is one of the major risk factors for heart disease. A total cholesterol reading above 190 mg/dL is considered high.A physician is concerned that a patient may be at risk for high cholesterol. In order to accurately measure the patient's average cholesterol level, the physician instructs the patient to come into the physician's office once a week for 12 weeks for a blood lipid screening. The results of the 12 measurements are listed below.
189
186
199
197
190
186
185
200
200
200
185
190
Use the critical value method to test the hypothesis that the patient's cholesterol level is greater than 190 mg/dL, using a significance level of 10%. Assume that the distribution of all cholesterol measurements from this patient is approximately normally distributed.
Determine the critical value(s) for this hypothesis test. Round the solution(s) to four decimal places. If more than one critical value exists, enter the solutions using a comma-separated list.Determine the test…
an attempt to develop a model of wine quality as judged by wine experts, data on alcohol content and wine quality was collected from variants of a particular wine. From a sample of 12wines, a model was created using the percentages of alcohol to predict wine quality. For those data, SR=18,671 and SST=27,382.Use this information to complete parts (a) through (c) below. Please complete part 3(B) ONLY.
Question content area bottom
Part 1
a. Determine the coefficient of determination,
r2,
and interpret its meaning.
r2=0.682
(Round to three decimal places as needed.)
Part 2
Interpret the meaning of r2.
It means that
68.2
of the variation in
wine quality
can be explained by the variation in
alcohol content.
(Round to one decimal place as needed.)
Part 3
b. Determine the standard error of the estimate.
SYX=
(Round to four decimal places as needed.)
Chapter 13 Solutions
Introduction To Statistics And Data Analysis
Ch. 13.1 - Let x be the size of a house (in square feet) and...Ch. 13.1 - Consider the variables and population regression...Ch. 13.1 - The flow rate in a device used for air quality...Ch. 13.1 - The paper Predicting Yolk Height, Yolk Width,...Ch. 13.1 - A sample of small cars was selected, and the...Ch. 13.1 - Prob. 6ECh. 13.1 - Suppose that a simple linear regression model is...Ch. 13.1 - a. Explain the difference between the line y x...Ch. 13.1 - Prob. 9ECh. 13.1 - Hormone replacement therapy (HRT) is thought to...
Ch. 13.1 - Consider the data and estimated regression line...Ch. 13.1 - A simple linear regression model was used to...Ch. 13.1 - Consider the accompanying data on x = Advertising...Ch. 13.2 - What is the difference between and b? What is the...Ch. 13.2 - The largest commercial fishing enterprise in the...Ch. 13.2 - Prob. 16ECh. 13.2 - Prob. 17ECh. 13.2 - Prob. 18ECh. 13.2 - An experiment to study the relationship between x...Ch. 13.2 - The paper The Effects of Split Keyboard Geometry...Ch. 13.2 - The authors of the paper Decreased Brain Volume in...Ch. 13.2 - Do taller adults make more money? The authors of...Ch. 13.2 - Researchers studying pleasant touch sensations...Ch. 13.2 - Prob. 24ECh. 13.2 - Acrylamide is a chemical that is sometimes found...Ch. 13.2 - Prob. 26ECh. 13.2 - Exercise 13.18 described a regression analysis...Ch. 13.2 - Consider the accompanying data on x = Research and...Ch. 13.2 - Prob. 29ECh. 13.2 - In anthropological studies, an important...Ch. 13.3 - The graphs accompanying this exercise are based on...Ch. 13.3 - Prob. 32ECh. 13.3 - Prob. 33ECh. 13.3 - The article Vital Dimensions in Volume Perception:...Ch. 13.3 - Prob. 35ECh. 13.3 - An investigation of the relationship between x =...Ch. 13.4 - Prob. 37ECh. 13.4 - Prob. 38ECh. 13.4 - In Exercise 13.19, we considered a regression of y...Ch. 13.4 - Prob. 40ECh. 13.4 - A subset of data read from a graph that appeared...Ch. 13.4 - Prob. 42ECh. 13.4 - Prob. 43ECh. 13.4 - The article first introduced in Exercise 13.34 of...Ch. 13.4 - The shelf life of packaged food depends on many...Ch. 13.4 - For the cereal data of the previous exercise, the...Ch. 13.4 - The article Performance Test Conducted for a Gas...Ch. 13.5 - Prob. 48ECh. 13.5 - Prob. 49ECh. 13.5 - A sample of n = 353 college faculty members was...Ch. 13.5 - Prob. 51ECh. 13.5 - Prob. 52ECh. 13.5 - The accompanying summary quantities for x =...Ch. 13.5 - Prob. 54ECh. 13.5 - Prob. 55ECh. 13.6 - Prob. 56ECh. 13 - Prob. 1CRECh. 13 - Prob. 2CRECh. 13 - Prob. 3CRECh. 13 - Prob. 4CRECh. 13 - Prob. 5CRECh. 13 - The accompanying graphical display is similar to...Ch. 13 - Prob. 7CRECh. 13 - Prob. 8CRECh. 13 - Consider the following data on y = Number of songs...Ch. 13 - Many people take ginkgo supplements advertised to...Ch. 13 - Prob. 11CRECh. 13 - Prob. 12CRECh. 13 - Prob. 13CRECh. 13 - Prob. 14CRECh. 13 - The discharge of industrial wastewater into rivers...Ch. 13 - Many people take ginkgo supplements advertised to...Ch. 13 - It is hypothesized that when homing pigeons are...Ch. 13 - Prob. 18CRECh. 13 - Prob. 57CRCh. 13 - Prob. 58CRCh. 13 - Prob. 59CRCh. 13 - The article Photocharge Effects in Dye Sensitized...Ch. 13 - Prob. 61CRCh. 13 - Prob. 62CRCh. 13 - Prob. 63CRCh. 13 - Prob. 64CRCh. 13 - Prob. 65CRCh. 13 - The article Improving Fermentation Productivity...Ch. 13 - Prob. 67CRCh. 13 - Prob. 68CRCh. 13 - Prob. 69CR
Knowledge Booster


Learn more about
Need a deep-dive on the concept behind this application? Look no further. Learn more about this topic, statistics and related others by exploring similar questions and additional content below.Similar questions
- Find the mean hourly cost when the cell phone described above is used for 240 minutes.arrow_forwardA college administrator wants to know if there is a significant difference between sexual orientation and level of family support for students at their college. The administrator takes a random sample of students who identify as gay/lesbian, bisexual or heterosexual/straight. There were 22 students sampled in each category. A measure of family support is given with higher scores indicating more family support. The means are as follows: Gay/lesbian Bisexual Heterosexual/Straight MG/L = 16 MBi = 17 MH/S = 22 Source SS df MS F Orientation 300 Error 2961 Total What is the F critical value?arrow_forwardA college administrator wants to know if there is a significant difference between sexual orientation and level of family support for students at their college. The administrator takes a random sample of students who identify as gay/lesbian, bisexual or heterosexual/straight. There were 22 students sampled in each category. A measure of family support is given with higher scores indicating more family support. The means are as follows: Gay/lesbian Bisexual Heterosexual/Straight MG/L = 16 MBi = 17 MH/S = 22 Source SS df MS F Orientation 300 Error 2961 Total What is the value of the F-statistic?arrow_forward
- A college administrator wants to know if there is a significant difference between sexual orientation and level of family support for students at their college. The administrator takes a random sample of students who identify as gay/lesbian, bisexual or heterosexual/straight. There were 22 students sampled in each category. A measure of family support is given with higher scores indicating more family support. The means are as follows: Gay/lesbian Bisexual Heterosexual/Straight MG/L = 16 MBi = 17 MH/S = 22 Source SS df MS F Orientation 300 Error 2961 Total What is the value of MS orientation?arrow_forwardA college administrator wants to know if there is a significant difference between sexual orientation and level of family support for students at their college. The administrator takes a random sample of students who identify as gay/lesbian, bisexual or heterosexual/straight. There were 22 students sampled in each category. A measure of family support is given with higher scores indicating more family support. The means are as follows: Gay/lesbian Bisexual Heterosexual/Straight MG/L = 16 MBi = 17 MH/S = 22 Source SS df MS F Orientation 300 Error 2961 Total What is the value of df error?arrow_forwardA college administrator wants to know if there is a significant difference between sexual orientation and level of family support for students at their college. The administrator takes a random sample of students who identify as gay/lesbian, bisexual or heterosexual/straight. There were 22 students sampled in each category. A measure of family support is given with higher scores indicating more family support. The means are as follows: Gay/lesbian Bisexual Heterosexual/Straight MG/L = 16 MBi = 17 MH/S = 22 Source SS df MS F Orientation 300 Error 2961 Total What is the value of df total?arrow_forward
- The mean GPA for 138 residents of the local apartment complex is 1.9. What is the best point estimate for the mean GPA for all residents of the local apartment complex?arrow_forwardPeriodically, the county Water Department tests the drinking water of homeowners for contminants such as lead and copper. The lead and copper levels in water specimens collected in 1998 for a sample of 10 residents of a subdevelopement of the county are shown below. lead (?μg/L) copper (mg/L) 3.33.3 0.6280.628 3.33.3 0.2930.293 0.30.3 0.7830.783 4.74.7 0.1950.195 55 0.3780.378 1.41.4 0.2330.233 0.90.9 0.1010.101 0.90.9 0.6980.698 3.63.6 0.80.8 1.21.2 0.7610.761 (a) Construct a 99% confidence interval for the mean lead level in water specimans of the subdevelopment. _____≤μ≤_____ (b) Construct a 99% confidence interval for the mean copper level in water specimans of the subdevelopment. ______≤μ≤______arrow_forwardPeriodically, the county Water Department tests the drinking water of homeowners for contaminants such as lead and copper. The lead and copper levels in water specimens collected in 1998 for a sample of 10 residents of a subdevelopement of the county are shown below. lead (g/L) copper (mg/L) 2.9 0.2 5.1 4.2 5.5 1.2 0.3 1.3 4.9 1.7 0.133 0.774 0.214 0.671 0.444 0.234 0.357 0.761 0.176 0.888 (a) Construct a 99% confidence interval for the mean lead level in water specimans of the subdevelopment. OSASO (b) Construct a 99% confidence interval for the mean copper level in water specimans of the subdevelopment. ≤H≤arrow_forward
- An investigation of the properties of bricks used to line aluminum smelter pots was published in an article. Six different commercial bricks were evaluated. The life span of a smelter pot depends on the porosity of the brick lining (the less porosity, the longer the life span); consequently, the researchers measured the apparent porosity of each brick specimen, as well as the mean pore diameter of each brick. See the table. Apparent Porosity (y). Mean Pore Diameter (x). Click the icon to view the table. Data table Mean Pore Diameter Apparent Porosity (%) (micrometers) Brick Interpret the y-intercept of the line. Choose the correct answer below. 18.7 12.0 В 18.3 9.8 O A. The y-intercept is Bo- This value has no meaning because 0 is not in the observed range of the independent variable mean pore diameter. 16.3 7.3 6.9 5.4 O B. The y-intercept is Bo: For each unit increase in mean pore diameter, the mean porosity is estimated to increase by B0- 17.2 10.9 O C. There is not enough…arrow_forwardplease help with part a,b, and d.arrow_forwardAnswer with letter and show complete solution.arrow_forward
arrow_back_ios
SEE MORE QUESTIONS
arrow_forward_ios
Recommended textbooks for you
 Glencoe Algebra 1, Student Edition, 9780079039897...AlgebraISBN:9780079039897Author:CarterPublisher:McGraw Hill
 Big Ideas Math A Bridge To Success Algebra 1: Stu...AlgebraISBN:9781680331141Author:HOUGHTON MIFFLIN HARCOURTPublisher:Houghton Mifflin Harcourt
 College Algebra (MindTap Course List)AlgebraISBN:9781305652231Author:R. David Gustafson, Jeff HughesPublisher:Cengage Learning
Glencoe Algebra 1, Student Edition, 9780079039897...
Algebra
ISBN:9780079039897
Author:Carter
Publisher:McGraw Hill
Big Ideas Math A Bridge To Success Algebra 1: Stu...
Algebra
ISBN:9781680331141
Author:HOUGHTON MIFFLIN HARCOURT
Publisher:Houghton Mifflin Harcourt
College Algebra (MindTap Course List)
Algebra
ISBN:9781305652231
Author:R. David Gustafson, Jeff Hughes
Publisher:Cengage Learning
Statistics 4.1 Point Estimators; Author: Dr. Jack L. Jackson II;https://www.youtube.com/watch?v=2MrI0J8XCEE;License: Standard YouTube License, CC-BY
Statistics 101: Point Estimators; Author: Brandon Foltz;https://www.youtube.com/watch?v=4v41z3HwLaM;License: Standard YouTube License, CC-BY
Central limit theorem; Author: 365 Data Science;https://www.youtube.com/watch?v=b5xQmk9veZ4;License: Standard YouTube License, CC-BY
Point Estimate Definition & Example; Author: Prof. Essa;https://www.youtube.com/watch?v=OTVwtvQmSn0;License: Standard Youtube License
Point Estimation; Author: Vamsidhar Ambatipudi;https://www.youtube.com/watch?v=flqhlM2bZWc;License: Standard Youtube License