
Videos
The article “Multi-objective Scheduling Problems: Determination of Pruned Pareto Sets” (H. Taboada and D. Coit, IIE Transactions, 2008:552–564). presents examples in a discussion of optimization methods for industrial scheduling and production planning. In one example, seven different jobs were performed on each of five machines. The cost of each job on each machine is presented in the following table. Assume that it is of interest to determine whether costs differ between machines, but that it is not of interest whether costs differ between jobs.
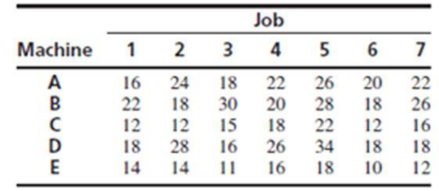
- a. Identify the blocking factor and the treatment factor.
- b. Construct an ANOVA table. You may give
ranges for the P-values. - c. Can you conclude that there are differences in costs between some pairs of machines? Explain.
- d. Which pairs of machines, if any, can you conclude, at the 5% level, to have differing mean costs?
Want to see the full answer?
Check out a sample textbook solution
Chapter 9 Solutions
Statistics for Engineers and Scientists
Additional Math Textbook Solutions
Basic Business Statistics, Student Value Edition (13th Edition)
Business Analytics
Elementary Statistics (13th Edition)
Statistics for Business & Economics, Revised (MindTap Course List)
Introductory Statistics (10th Edition)


- 2 Required information The article "Multi-objective Scheduling Problems: Determination of Pruned Pareto Sets" (H. Taboada and D. Coit, IIE Transactions, 2008:552-564), presents examples in a discussion of optimization methods for industrial scheduling and production planning. In one example, seven different jobs were performed on each of five machines. The means and standard deviations of the processing times for each machine are presented in the following table. Machine Mean SD Sample Size A 25.43 10.67 7 B 23.71 13.92 7 k C 44.57 15.90 7 t D E 23.14 12.75 7 58.00 19.11 7 i < nces Construct an ANOVA table. (Enter your Sum of Squares, Mean Sum of Squares, and F calculations rounded to three decimal places.) Source DF Machine SS MS P F (Click to select) Error Totalarrow_forward3. Research Problem: Job satisfaction as a function of work schedule was investigated in two different factories. In the first factory the employees are on a fixed shift system while in the second factory the workers have a rotating shift system. Under the fixed shift system, a worker always works the same shift, while under the rotating shift system, a worker rotates through the three shifts. Using the scores below determine if there is a significant difference in job satisfaction between the two groups of workers. Work Satisfaction Scores for Two Groups of Workers Rotating Shift 63 71 46 57 53 46 57 76| 52 68 32 Fixed Shift 79 83 68 59 81 76 80 74 58 49 Carry out an appropriate statistical analysis using alpha=0.001 a) Which shift is better Rotating Shift or Fixed Shift and Why b) On the two graphs below draw what you think the distribution of values around the mean for Rotating Shift and Fixed Shift would look like.arrow_forward3. Research Problem: Job satisfaction as a function of work schedule was investigated in two different factories. In the first factory the employees are on a fixed shift system while in the second factory the workers have a rotating shift system. Under the fixed shift system, a worker always works the same shift, while under the rotating shift system, a worker rotates through the three shifts. Using the scores below determine if there is a significant difference in job satisfaction between the two groups of workers. Work Satisfaction Scores for Two Groups of Workers Rotating Shift 63 71 46 | 57 53 46 57 76 52 68 32 Fixed Shift 79 83 68 59 81 76 80 74 58 49 Carry out an appropriate statistical analysis using alpha=D0.001 a) What is the probability value for the null hypothesis being correct? b) Which shift is better Rotating Shift or Fixed Shift and Why c) On the two graphs below draw what you think the distribution of values around the mean for Rotating Shift and Fixed Shift would look…arrow_forward
- Once QBA 362 final exam is done, it will be time to reward Professor Hong with a well-deserved vacation. As a state employee, professor Hong hasn’t seen a raise since... well, ever.Thus, an important criterion, in fact the most important criterion is to find an exoticregion that can be visited inexpensively. There are three states of nature that could impact costs in these five areas of interest. Professor Hong has determined the average cost per day to visit each region under each of the possible states of nature. This table, which should not be construed as actual vacation advice, appears below. (Remember they are costs. Lower is better. For example, the most optimistic case is the one with lowest cost.) Region Strong Dollar Middling Dollar Weak Dollar Eastern Europe 33 54 57 Southeast Asia 41 56 36 Australia 45 44 58 Galapagos Islands 37 35 26…arrow_forwardThe article "A Robust Optimization Approach for the Capacitated Vehicle Routing Problem with Demand Uncertainty" (I. Sungur, F. Ordonez, and M. Dessouky, IIE Transactions, 2008:509-523) discusses methods to reduce transportation costs while satisfying demands. In one study, the percent demand that is unmet (y) and the percent of vehicle capacity (x) needed to meet the expected demand were recorded for 27 different scenarios. The results are presented in the following table. х У 0.5 82 0.0 0.7 1.3 0.8 11 0.9 1.2 1.3 0.2 0.8 1.4 0.9 1.4 0.4 1.7 93 11 93 0.8 90 0.3 0.2 1.0 1.0 89 1.0 93 1.3 91 1.3 94 1.2 94 0.7 Compute the least-squares line for predicting unmet demand (y) from vehicle capacity (X). b. Compute 95% confidence intervals for B, and B,- Predict the unmet demand when the vehicle capacity is 93%. d. a. c. Find a 95% confidence interval for the mean unmet demand when the vehide capacity is 93%. Find a 95% prediction interval for the unmet demand for a scenario whose vehicle…arrow_forward3. Research Problem Job satisfaction as a function of work schedule waS investigated in two different factories. In the first factory the employees are on a fixed shift system while in the second factory the workers have a rotating shift system. Under the fixed shift system, a worker ahways works the same shift, while under the rotating shift system, 8 worker rotates through the three shifts. Using the scores below determine if there is a significant difference in job satisfaction between the two groups of workers. Work Satisfaction Scores for Two Groups of Workers Rotating Shift 63 71 48 57 53 48 57 76 52 68 Fixed Shift 79 83 68 59 81 76 80 74 58 49 68 Carry out an sppropriate statistical analysis using alpha=D0.001 and complete the table: Rotating Shift Fixed Shift t Stat P(T<-1) two-tal t Critical two-tail d) What is the probability value for the null hypothesis being correct? e) What is the alternative hypothesis f What is your conclusion with two reasons? g) Which shift is better…arrow_forward
- Anil and Bala have the choice of using either Integrated Pest Control (IPC) or Terminator (T) to solve the problem of pest insects. The table below shows their payoffs depending on their choice. The following diagram shows these possible outcomes on a graph. Based on the information above, which of the following is correct? a.(I, I) is the unique Pareto efficient outcome. b.Anil and Bala can Pareto improve by moving from (T, T) to (T, I). c.(T, T) is the only Pareto inefficient outcome. d.Anil and Bala will both be happy to move from the Pareto efficient (I, T) to the "fairer" Pareto efficient outcome (I, I).arrow_forward(a) Compute four-week and five-week moving averages for the time series. 4-Week 5-Week Time Series Moving Average Forecast Moving Average Forecast Week Value 1 17 2 21 19 4 24 5 18 6 16 7 20 8 18 22 10 20 11 15 12 23 (b) Compute the MSE for the four-week moving average forecasts. (Round your answer to two decimal places.) Compute the MSE for the five-week moving average forecasts. (Round your answer to two decimal places.)arrow_forwardThe project manager has obtained a non-uniform distribution of resources all along the project. She is trying to smooth the resource histogram to achieve a uniform resource distribution. Based on which condition resource smoothing would be impossible. Resource smoothing is always possible; it depends on project manager's knowledge and experience -O b. All activities are critical O c. Some activities are critical and some are non-critical O d. All activities are non-criticalarrow_forward
- A researcher wondered if attainment within six years among students who receive grants as sart of their educational funding (Group 1) was lower than attainment within six years among students who did not receive grants as part of their educational funding (Group 2). Atainment is defined as whether the student earned the degree or certificate that heishe set out to eam upon enrolment. Complete parts (a) through (c) below. A. 2 1 Cannot be determined (c) In part (b), we learned that two groups (students who receive grants and students who do not receive grants) are being compared. In addition, the sampling method is independent. State the null and altemative hypotheses for this test Hg.arrow_forwardA wood products firm uses leftover time at the end of each week to make goods for stock. Currently, there are two products on the list of items that are produced for stock: a chopping board and a knife holder. Both items require three operations: cutting, gluing, and finishing. The manager of the firm has collected the following data on these products: ------------------------------------------------------- Time per unit (minutes) Profit ---------------------------- Item per unit Cutting Gluing Finishing ------------------------------------------------------- Chopping board $ 4 1.4 5 12 Knife holder $ 6 1.8 13 3 ------------------------------------------------------- The manager has also determined that during each week 120 minutes are available for cutting, 650 minutes are available for gluing, and 360…arrow_forwardOne major factor in low productivity is the amount of time wasted by workers. Wasted time could include things such as time spent waiting for more material and equipment, cleaning up mistakes, and performing any other activity not related to production. In a project designed to examine this problem, a consultant took a survey of 200 workers in companies that were classified as successful (on the basis of their latest annual profits) and another 200 workers from unsuccessful companies. The amount of time (in hours) wasted during a standard 40-hour workweek was recorded for each worker. Do these data provide enough evidence at the 5% significance level to infer that the amount of time wasted in unsuccessful firms exceeds that of successful ones? To answer this question, the consultant ran several analyses and provided the out below. Note that none of these analyses might be correct. A. H0: (μ1 - μ2) = 0 H1: (μ1 - μ2) > 0 B. H0: μD = 0 H1: μD > 0 C. H0: μD = 0…arrow_forward
 MATLAB: An Introduction with ApplicationsStatisticsISBN:9781119256830Author:Amos GilatPublisher:John Wiley & Sons Inc
 Probability and Statistics for Engineering and th...StatisticsISBN:9781305251809Author:Jay L. DevorePublisher:Cengage Learning
 Statistics for The Behavioral Sciences (MindTap C...StatisticsISBN:9781305504912Author:Frederick J Gravetter, Larry B. WallnauPublisher:Cengage Learning
 Elementary Statistics: Picturing the World (7th E...StatisticsISBN:9780134683416Author:Ron Larson, Betsy FarberPublisher:PEARSON
 The Basic Practice of StatisticsStatisticsISBN:9781319042578Author:David S. Moore, William I. Notz, Michael A. FlignerPublisher:W. H. Freeman
 Introduction to the Practice of StatisticsStatisticsISBN:9781319013387Author:David S. Moore, George P. McCabe, Bruce A. CraigPublisher:W. H. Freeman