
Videos
Archaeologists can determine the diets of ancient civilizations by measuring the ratio of carbon-13 to carbon-12 in bones found at burial sites. Large amounts of carbon-13 suggest a diet rich in grasses such as maize, while small amounts suggest a diet based on herbaceous plants. The article “Climate and Diet in Fremont Prehistory: Economic Variability and Abandonment of Maize Agriculture in the Great Salt Lake Basin” (J. Coltrain and S. Leavitt, American Antiquity. 2002:453–485) reports ratios, as a difference from a standard in units of ports per thousand, for bones from individuals in several age groups. The data are presented in the following table.
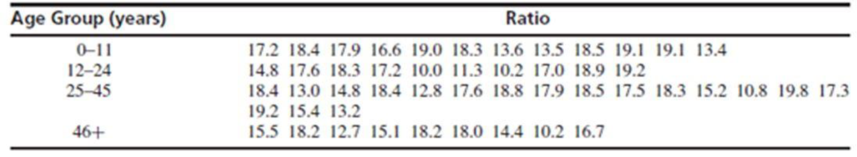
- a. Construct an ANOVA table. You may give a
range for the P-value. - b. Can you conclude that the concentration ratios differ among the age groups?
Want to see the full answer?
Check out a sample textbook solution
Chapter 9 Solutions
Statistics for Engineers and Scientists
Additional Math Textbook Solutions
Introductory Statistics
Essentials of Statistics, Books a la Carte Edition (5th Edition)
An Introduction to Mathematical Statistics and Its Applications (6th Edition)
Elementary Statistics Using the TI-83/84 Plus Calculator, Books a la Carte Edition (4th Edition)
PRACTICE OF STATISTICS F/AP EXAM
Basic Business Statistics, Student Value Edition


- Urban Travel Times Population of cities and driving times are related, as shown in the accompanying table, which shows the 1960 population N, in thousands, for several cities, together with the average time T, in minutes, sent by residents driving to work. City Population N Driving time T Los Angeles 6489 16.8 Pittsburgh 1804 12.6 Washington 1808 14.3 Hutchinson 38 6.1 Nashville 347 10.8 Tallahassee 48 7.3 An analysis of these data, along with data from 17 other cities in the United States and Canada, led to a power model of average driving time as a function of population. a Construct a power model of driving time in minutes as a function of population measured in thousands b Is average driving time in Pittsburgh more or less than would be expected from its population? c If you wish to move to a smaller city to reduce your average driving time to work by 25, how much smaller should the city be?arrow_forwardull alfa ? 10:42 AM O 27% O Table 1 Tennis balls $2 2014 Golf balls Bottles of Gatorade Price $4 $1 Quantity 100 100 200 Tennis balls $2 2015 Golf balls Bottles of Gatorade Price $6 $2 Quantity 100 100 200 1. Refer to Table 1. Cost of market basket in 2014 and in 2015: * $800, $1200 $600, $1500 $500, $900 $900, $1000arrow_forward2. An engineer suspects that the surface finish of metal parts is influenced by the type of paint used and the drying time. He selected three drying times-20, 25, and 30 minutes-and used two types of paint. Three parts are tested with each combination of paint type and drying time. The data are as follows: Drying Time (min) Paint 20 25 30 1 74 73 78 64 61 85 50 44 92 92 98 66 86 73 45 68 88 85 a. State the hypotheses of interest in this experiment. b. Test the above hypotheses and draw conclusions using the analysis of variance with a = 0.05.arrow_forward
 Calculus For The Life SciencesCalculusISBN:9780321964038Author:GREENWELL, Raymond N., RITCHEY, Nathan P., Lial, Margaret L.Publisher:Pearson Addison Wesley,
 Functions and Change: A Modeling Approach to Coll...AlgebraISBN:9781337111348Author:Bruce Crauder, Benny Evans, Alan NoellPublisher:Cengage Learning