
Videos
The article “Factorial Experiments in the Optimization of Alkaline Wastewater Pretreatment” (M. Prisciandaro. A. Del Borghi, and F. Veglio, Industrial Engineering and Chemistry Research, 2002:5034–5041) presents the results of several experiments to investigate methods of treating alkaline wastewater. One experiment was an unreplicated 24 design. The four factors were A: concentration of sulfuric acid. B: temperature. C: time, and D: concentration of calcium chloride. The outcome variable is the amount of precipitate in kg/m3 The results are presented in the following table.
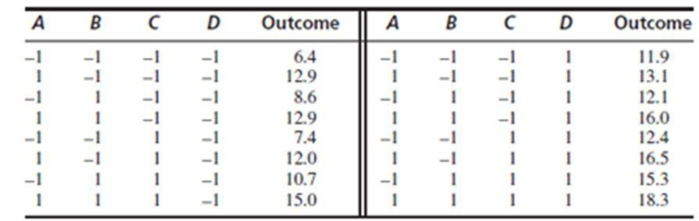
- a. Estimate all main effects and interactions.
- b. Which effects seem to be larger than the others?
- c. Assume that all third-and higher-order interactions are equal to 0, and add their sums of squares. Use the result in place of an error sum of squares to compute F statistics and P-values for the main effects. Which factors can you conclude to have an effect on the outcome?
- d. The article described some replicates of the experiment, in which the error mean square was found to be 1.04, with four degrees of freedom. Using this value, compute F statistics and P-values for all main effects and interactions.
- e. Do the results of part (d) help to justify the assumption that the third-and higher-order interactions are equal to 0? Explain.
- f. Using the results of part (d), which factors can you conclude to have an effect on the outcome?
Want to see the full answer?
Check out a sample textbook solution
Chapter 9 Solutions
Statistics for Engineers and Scientists
Additional Math Textbook Solutions
Elementary Statistics: Picturing the World (6th Edition)
Essentials of Statistics (6th Edition)
Elementary Statistics Using Excel (6th Edition)
Business Statistics: A First Course (8th Edition)
Introductory Statistics
Basic Business Statistics, Student Value Edition


- 1. (Prob. 11-12, p. 438) An article in the Journal of Environmental Engineering (1989, Vol. 115(3), pp. 608–619) reported the results of a study on the occurrence of sodium and chloride in surface streams in central Rhode Island. The following data are chloride concentration y (in milligrams per liter) and roadway area in the watershed x (in percentage). y 4.4 6.6 9.7 10.6 10.8 10.9 0.19 0.15 0.57 0.70 0.67 0.63 y 11.8 12.1 14.3 14.7 15.0 17.3 0.47 0.70 0.60 0.78 0.81 0.78 y 19.2 23.1 27.4 27.7 31.8 39.5 0.69 1.30 1.05 1.06 1.74 1.62 a. Draw a scatter diagram of the data. Does a simple linear regression model seem appropriate here? b. Fit the simple linear regression model using the method of least squares. Find an estimate of o?. C. Estimate the mean chloride concentration for a watershed that has 1% roadway area. d. Find the fitted value corresponding to x = 0.47 and the associated residual.arrow_forwardThe authors of the paper "Statistical Methods for Assessing Agreement Between Two Methods of Clinical Measurement" compared two different instruments for measuring a subject's ability to breathe out air.+ (This measurement is helpful in diagnosing various lung disorders.) The two instruments considered were a Wright peak flow meter and a mini-Wright peak flow meter. Seventeen subjects participated in the study, and for each subject air flow was measured once using the Wright meter and once using the mini-Wright meter. Mini- Subject Wright Meter 1 2 3 4 5 6 7 8 9 512 430 520 428 500 600 364 380 658 Wright Meter 494 395 516 434 476 557 413 442 650 Subject 10 11 12 13 14 15 16 17 Mini- Wright Meter 445 432 626 260 477 259 350 451 Wright Meter 433 417 656 267 478 178 423 427 (a) Suppose that the Wright meter is considered to provide a better measure of air flow, but the mini-Wright meter is easier to transport and to use. If the two types of meters produce different readings but there is a…arrow_forwardThe Journal of Engineering in Industry (Aug. 1993) reported on an automated system designed to replace the cutting tool of a drilling machine at optimum times. To test the system, data were collected over a broad range of materials, drill sizes, drill speeds, and feed rates – called machining conditions. Although a total of 168 different machining conditions were possible, only eight were employed in this study. These are described below: Experiment Workpiece Drill Size (in.) 25 25 Drill Speed (грт) 1250 1800 Feed Rate Material (ipr) .011 .005 1 Cast Iron Cast Iron Steel Steel 25 25 3750 2500 .003 .003 .008 4 Steel 25 .125 .125 2500 Steel Steel 4000 4000 3000 .0065 .009 .010 Steel .125 a. Suppose one (and only one) of the 168 possible machining conditions will detect a flaw in the system. What is the probability that the experiment conducted in the study will detect the system flaw? b. Suppose the system flaw occurs when drilling steel material with a 25-inch drill size at a speed of…arrow_forward
- The article "Factorial Experiments in the Optimization of Alkaline Wastewater Pretreatment" (M. Prisciandaro, A. Del Borghi, and F. Veglio, Industrial Engineering and Chemistry Research, 2002:5034-5041) presents the results of an experiment to investigate the effects of the concentrations of sulfuric acid (H,So,) and calcium chloride (CaCl,) on the amount of black mud precipitate in the treatment of alkaline wastewater. There were three levels of each concentration, and two replicates of the experiment were made at each combination of levels. The results are presented in the following table (all measurements are in units of kg/m). H;5O, CaCl, 15 Precipitate 100.2 110 98.2 110 30 175.8 216.5 176.2 110 45 206.0 123 15 110.5 105.5 123 30 45 184.7 189.0 123 234.0 222.0 136 15 106.5 107.0 136 30 1817 189.0 136 45 211.8 201.3 a Construct an ANOVA table. You may give ranges for the P-values. b. Is the additive model plausible? Explain. c. Can you concude that H,S0, concentration affects the…arrow_forwardThe authors of the paper "Statistical Methods for Assessing Agreement Between Two Methods of Clinical Measurement" compared two different instruments for measuring a subject's ability to breathe out air.† (This measurement is helpful in diagnosing various lung disorders.) The two instruments considered were a Wright peak flow meter and a mini-Wright peak flow meter. Seventeen subjects participated in the study, and for each subject air flow was measured once using the Wright meter and once using the mini-Wright meter. Subject 1 2 3 4 5 6 7 8 9 Mini- Wright Meter 512 430 520 428 500 600 364 380 658 Wright Meter + 494 395 516 434 476 557 413 442 650 Subject 10 11 12 13 14 15 16 17 Mini- Wright Meter 445 432 626 260 477 259 350 451 Wright Meter 433 417 656 267 478 178 423 427 (a) Suppose that the Wright meter is considered to provide a better measure of air flow, but the mini-Wright meter is easier to transport and to use. If the two types of meters produce different readings but there is…arrow_forwardThe authors of the paper "Statistical Methods for Assessing Agreement Between Two Methods of Clinical Measurement" compared two different instruments for measuring a subject's ability to breathe out air.† (This measurement is helpful in diagnosing various lung disorders.) The two instruments considered were a Wright peak flow meter and a mini-Wright peak flow meter. Seventeen subjects participated in the study, and for each subject air flow was measured once using the Wright meter and once using the mini-Wright meter. Subject Mini-WrightMeter WrightMeter Subject Mini-WrightMeter WrightMeter 1 512 494 10 445 433 2 430 395 11 432 417 3 520 516 12 626 656 4 428 434 13 260 267 5 500 476 14 477 478 6 600 557 15 259 178 7 364 413 16 350 423 8 380 442 17 451 427 9 658 650 (a) Suppose that the Wright meter is considered to provide a better measure of air flow, but the mini-Wright meter is easier to transport and to use. If the two types of meters produce…arrow_forward
- Foot ulcers are a common problem for people with diabetes. Higher skin temperatures on the foot indicate an increased risk of ulcers. The article "An Intelligent Insole for Diabetic Patients with the Loss of Protective Sensation" (Kimberly Anderson, M.S. Thesis, Colorado School of Mines), reports measurements of temperatures, in °F, of both feet for 181 diabetic patients. The results are presented in the following table. Left Foot Right Foot 80 80 85 85 75 80 88 86 89 87 87 82 78 78 88 89 89 90 76 81 89 86 87 82 78 78 80 81 87 82 86 85 76 80 88 89 Construct a scatterplot of the right foot temperature (y) versus the left foot temperature (x). Verify that a linear model is appropriate. b. Compute the least-squares line for predicting the right foot temperature from the left foot temperature. If the left foot temperatures of two patients differ by 2 degrees, by how much would you predict their right foot temperatures to differ? Predict the right foot temperature for a patient whose left…arrow_forwardCompare the two separate scatterplots. In particular, how do the associtation compare between women with pets vs. women without pets? Does one group have more variation in systolic blood pressure than the other? If so, for which group? Does systolic blood pressure seem higher for common ages between the two groups? If so, for which group?arrow_forwardSamples of emissions from three suppliers are classified for conformance to air-quality specifications. The results from 100 samples are summarized as follows I need a step-by-step solution and an explanation. Thank you!arrow_forward
- The article "Effect of Refrigeration on the Potassium Bitartrate Stability and Composition of Italian Wines" (A. Versari, D. Barbanti, et al., Italian Journal of Food Science, 2002:45- 52) reports a study in which eight types of white wine had their tartaric acid concentration (in g/L) measured both before and after a cold stabilization process. The results are presented in the following table: Wine Type Before After Difference 2.86 2.59 0.27 2.85 2.47 0.38 3 1.84 1.58 0.26 4 1.60 1.56 0.04 0.80 0.78 0.02 6. 0.89 0.66 0.23 2.03 1.87 0.16 1.90 1.71 0.19 Find a 95% confidence interval for the mean difference between the tartaric acid concentrations before and after the cold stabilization process.arrow_forward1.“Effects of Short-Term Supplementation with Selenised Yeast on Milk Production and Composition of Lactating Cows”(Australian Journal of Dairy Technology, [2004]: 199-203) supplied the following data on milk selenium concentration (mg/L) for a sample of cows given seleniumsupplement (the treatment group) and a sample of cows given no supplement (the control group). The measurements of selenium were taken initally and again after a 9-day period. The study was conducted becausea deficiency of the trace element selenium in the diet can negatively impact growth, immunity, muscle and neuromuscular function, and fertility. The production of selenium supplements to dairy cows is justified when pastures have low selenium levels. data is attached a.Use the given data for the treatment group to determine if there is sufficient evidenceto conclude that the mean selenium concentration is greater after 9 days of the selenium supplement. b.Are the data for the cows in…arrow_forwardThe Lion’sMane. In a study by P. M.West titled “The Lion’s Mane” (American Scientist, Vol. 93, No. 3, pp. 226–236), the effects of the mane of a male lion as a signal of quality to mates and rivals was explored. Four life-sized dummies of male lions provided a tool for testing female response to the unfamiliar lions whose manes varied by length (long or short) and color (blonde or dark). The female lions were observed to see whether they approached each of the four life-sized dummies. a. experimental units. b. response variable. c. factor(s). d. levels of each factor. e. treatments.arrow_forward
 Calculus For The Life SciencesCalculusISBN:9780321964038Author:GREENWELL, Raymond N., RITCHEY, Nathan P., Lial, Margaret L.Publisher:Pearson Addison Wesley,