
Videos
Adding glass panicles to clay brick may improve the structural properties of the brick. The article “Effects of Waste Glass Additions on the Properties and Durability of Fined Clay Brick” (S. Chidiac and L. Federico, Can J Civ Eng. 2007:1458–1466) describes experiments in which the compressive strength (in MPa) was measured for bricks with varying amounts of glass content and glass particle size. The results in the following table are consistent with means and standard deviations presented in the article.
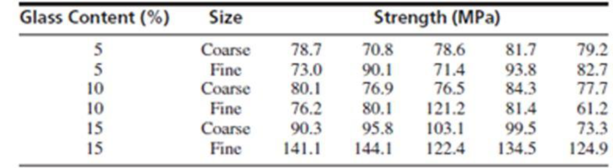
- a. Estimate all main effects and interactions.
- b. Construct an ANOVA table. You may give
ranges for the P-values. - c. Is the additive model plausible? Provide the value of a test statistic and the P-value.
- d. Can the effect of glass content on strength be described by interpreting the main effects of glass content? If so, interpret the main effects, including the appropriate test statistic and P-value. If not, explain why not.
- e. Can the effect of particle size on strength be described by interpreting the main effects of particle size? If so, interpret the main effects, including the appropriate test statistic and P-value. If not, explain why not.
Want to see the full answer?
Check out a sample textbook solution
Chapter 9 Solutions
Statistics for Engineers and Scientists
Additional Math Textbook Solutions
Probability and Statistics for Engineering and the Sciences
Elementary Statistics: A Step By Step Approach
Elementary Statistics Using the TI-83/84 Plus Calculator, Books a la Carte Edition (4th Edition)
Essentials of Statistics (6th Edition)


- A study of the properties of metal plate-connected trusses used for roof support yielded the following observations on axial stiffness index (kips/in.) for plate lengths 4, 6, 8, 10, and 12 in: 4: 333.2 409.5 311.0 326.5 316.8 349.8 309.7 6: 433.1 347.2 361.0 404.5 331.0 348.9 381.7 8: 382.4 366.2 351.0 357.1 409.9 367.3 382.0 10: 350.7 452.9 461.4 433.1 410.6 384.2 362.6 12: 413.4 441.8 419.9 410.7 473.4 441.2 465.8 LUSE SALT Does variation in plate length have any effect on true average axial stiffness? State the relevant hypotheses using analysis of variance. O Hoi Hy #fly #Hz" Ha #Hs H: all five μ's are equal O Hoi H₂H₂ = H3 = HaHs H: at least two μ's are unequal O Hoi H₂ = H₂ = H₂ "HaHs H: all five μ's are unequal O Hoi H₂ #4₂ # Hz*H4 *H5 H: at least two μ's are equal Test the relevant hypotheses using analysis of variance with a = 0.01. Display your results in an ANOVA table. (Round your answers to two decimal places.) Degrees of Sum of Mean freedom Squares Squares Error Total…arrow_forwardA study of the properties of metal plate-connected trusses used for roof support yielded the following observations on axial stiffness index (kips/in.) for plate lengths 4, 6, 8, 10, and 12 in: 4: 315.2 409.5 311.0 326.5 316.8 349.8 309.7 6: 405.1 347.2 361.0 404.5 331.0 348.9 381.7 8: 399.4 366.2 351.0 357.1 409.9 367.3 382.0 10: 353.7 452.9 461.4 433.1 410.6 384.2 362.6 12: 417.4 441.8 419.9 410.7 473.4 441.2 465.8 n USE SALT Does variation in plate length have any effect on true average axial stiffness? State the relevant hypotheses using analysis of variance. O Ho: H1# H2 # Hz# H4# H5 H: at least two µ's are equal O Ho: H1 = H2 = H3= H4= H5 H: at least two u's are unequal O Ho: H1 # H2 # Hz# H4# Hs H: all five u's are equal O Ho: H1 = H2 = Hz3 = H4= Hs H: all five u,'s are unequal Test the relevant hypotheses using analysis of variance with a = 0.01. Display your results in an ANOVA table. (Round your answers to two decimal places.) Degrees of freedom Sum of Squares Mean Source…arrow_forwardA study of the properties of metal plate-connected trusses used for roof support yielded the following observations on axial stiffness index (kips/in.) for plate lengths 4, 6, 8, 10, and 12 in: 4: 329.2 409.5 311.0 326.5 316.8 349.8 309.7 6: 425.1 347.2 361.0 404.5 331.0 348.9 381.7 8: 389.4 366.2 351.0 357.1 409.9 367.3 382.0 10: 341.7 452.9 461.4 433.1 410.6 384.2 362.6 12: 414.4 441.8 419.9 410.7 473.4 441.2 465.8 USE SALT Does variation in plate length have any effect on true average axial stiffness? State the relevant hypotheses using analysis of variance. O Ho: M₁ = H₂ = 13 = H4 = 1₂ H₂: all five μ's are unequal O Ho: My H₂ H3 ‡ M4 # M5 H₂: at least two μ's are equal O Ho: My # H₂ H3 # H4 # H5 H₂: all five us are equal = = o Hỏi khi là không = 3 = Mà khô H₂: at least two μ's are unequal Test the relevant hypotheses using analysis of variance with a = 0.01. Display your results in an ANOVA table. (Round your answers to two decimal places.) Sum of Squares Source Treatments Error…arrow_forward
- A study of the properties of metal plate-connected trusses used for roof support yielded the following observations on axial stiffness index (kips/in.) for plate lengths 4, 6, 8, 10, and 12 in: 4: 321.2 409.5 311.0 326.5 316.8 349.8 309.7 6: 439.1 347.2 361.0 404.5 331.0 348.9 381.7 8: 390.4 366.2 351.0 357.1 409.9 367.3 382.0 10: 362.7 452.9 461.4 433.1 410.6 384.2 362.6 12: 402.4 441.8 419.9 410.7 473.4 441.2 465.8 USE SALT Does variation in plate length have any effect on true average axial stiffness? State the relevant hypotheses using analysis of variance. ○ Ho: H₁ = H₂ = H3 = H4=H5 Ha: all five u's are unequal O Ho: H₁ H₂ H3 H4 H5 Ha: all five μ's are equal Ho H₁ = ₂ = 3 = H4 = 5 H₂: at least two μ's are unequal Ho: H₁ H₂ H3 H4 H5 Ha: at least two μ's are equal Test the relevant hypotheses using analysis of variance with a = 0.01. Display your results in an ANOVA table. (Round your answers to two decimal places.) Mean Degrees of Sum of freedom Squares Squares Source Treatments…arrow_forward1. Analyze the data as a two way factorial design. Johnson and Leone (Statistics and Experimental Design in Engineering and the Physical Sciences, Wiley, 977) describe an experiment to investigate warping of copper plates. The two factors studied were the temperature and the copper content of the plates. The response variable was a measure of the amount of warping. The data were as follows: Temperature (°C) 50 75 100 125 40 17, 20 12,9 16, 12 21, 17 Copper Content (%) 60 80 16, 21 18, 13 18, 21 23, 2! 24, 22 17, 12 25, 23 23, 22 100 28, 27 27, 31 30, 23 29, 31arrow_forwardAn article in the Fire Safety Journal (“The Effect of Nozzle Design on the Stability and Performance of Turbulent Water Jets,” Vol. 4, August 1981) describes an experiment in which a shape factor was determined for several different nozzle designs at six levels of jet efflux velocity. Interest focused on potential differences between nozzle designs (blocks), with velocity considered as a nuisance variable. The data are shown below: Jet Efflux Velocity (m/s) Nozzle Design 11.73 14.37 16.59 20.43 23.46 28.74 1 0.78 0.80 0.81 0.75 0.77 0.78 2 0.85 0.85 0.92 0.86 0.81 0.83 3 0.93 0.92 0.95 0.89 0.89 0.83 4 1.14 0.97 0.98 0.88 0.86 0.83 5 0.97 0.86 0.78 0.76 0.76 0.75 1) Write the null hypothesis and the alternative hypothesis (for the factor). 2) Find the ANOVA table. (round to five decimal places). 3) What is your decision about the null hypothesis, consider ?. 4) If your decision in part (4) was reject , perform Tukey test to determine which pairwise means are…arrow_forward
- Please show me your solutions and interpretations. Show the completehypothesis-testing procedure.An article in the ASCE Journal of Energy Engineering (1999, Vol. 125, pp. 59–75) describes a study of the thermal inertia properties of autoclaved aerated concrete used as a building material. Five samples of the material were tested in a structure, and the average interior temperatures (°C) reported were as follows: 23.01, 22.22, 22.04, 22.62, and 22.59. Test that the average interior temperature is equal to 22.5 °C using α = 0.05.arrow_forward54. Grip is applied to produce normal surface forces that compress the object being gripped. Examples include two people shaking hands, or a nurse squeezing a patient's forearm to stop bleeding. The article "Investigation of Grip Force, Normal Force, Contact Area, Hand Size, and Handle Size for Cylindrical Handles" (Human Factors, 2008: 734-744) included the following data on grip strength (N) for a sample of 42 individuals: 16 18 18 26 33 41 54 56 66 68 87 91 95 98 106 109 111 118 127 127 135 145 147 149 151 168 172 183 189 190 200 210 220 229 230 233 238 244 259 294 329 403 a. Construct a stem-and-leaf display based on repeat- ing each stem value twice, and comment on inter- esting features. b. Determine the values of the fourths and the fourthspread. c. Construct a boxplot based on the five-number sum- mary, and comment on its features. 5arrow_forwardThe article "Experimental Measurement of Radiative Heat Transfer in Gas-Solid Suspension Flow System" (G. Han, K. Tuzla, and J. Chen, AIChe Journal, 2002:1910- 1916) discusses the calibration of a radiometer. Several measurements were made on the electromotive force readings of the radiometer (in volts) and the radiation flux (in kilowatts per square meter). The results (read from a graph) are presented in the following table. Heat flux (y) 15 31 51 55 67 89 Signal output (x) 1.08 2.42 4.17 4.46 5.17 6.92 Compute the least-squares line for predicting heat flux from the signal output. If the radiometer reads 3.00 V, predict the heat flux. If the radiometer reads 8.00 V, should the heat flux be predicted? If so, predict it. If not, explain why. C.arrow_forward
- The article "Modeling Resilient Modulus and Temperature Correction for Saudi Roads" (H. Wahhab, I. Asi, and R. Ramadhan, Journal of Materials in Civil Engineering, 2001:298– 305) describes a study designed to predict the resilient modulus of pavement from physical properties. The following table presents data for the resilient modulus at 40°Cin10® kPa (y), the surface area of the aggregate in m²/kg (x1), and the softening point of the asphalt in °C (х). y X1 X2 1.48 5.77 60.5 1.70 7.45 74.2 2.03 8.14 67.6 2.86 8.73 70.0 2.43 7.12 64.6 3.06 6.89 65.3 2.44 8.64 66.2 1.29 6.58 64.1 3.53 9.10 68.6 1.04 8.06 58.8 1.88 5.93 63.2 1.90 8.17 62.1 1.76 9.84 68.9 2.82 7.17 72.2 1.00 7.78 54.1 The full quadratic model is y = + P,x, + PzX, + Pz*jXz + Pxx¡ + Bzx; + €. Which submodel of this full model do you believe is most appropriate? Justify your answer by fitting two or more models and comparing the results.arrow_forwardThe article "Effect of Granular Subbase Thickness on Airfield Pavement Structural Response" (K. Gopalakrishnan and M. Thompson, Journal of Materials in Civil Engineering, 2008:331-342) presents a study of the amount of surface deflection caused by aircraft landing on an airport runway. A load of 160 kN was applied to a runway surface, and the amount of deflection in mm (y) was measured at various distances in m (x) from the point of application. The results are presented in the following table. y 0.000 3.24 0.305 2.36 0.610 1.42 0.914 0.87 1.219 0.54 1.524 0.34 1.830 0.24 a. Fit the linear model y = Bo + B1x + ɛ. For each coefficient, test the hypothesis that the coefficient is equal to 0. b. Fit the quadratic model y = Bo + Bịx + B2x² + ɛ. For each coefficient, test the hypothesis that the coefficient is equal to 0. %3D Fit the cubic model y = Bo + B1x + B2x? + B3x + E. For each coefficient, test the C. hypothesis that the coefficient is equal to 0. d. Which of the models in parts (a)…arrow_forwardRecently there has been increased use of stainless steel claddings in industrial settings. Claddings are used to finish the exterior walls of a building and help weatherproof the structure. To ensure the quality of claddings, it is essential to know how welding parameters impact the cladding process. The authors of “Mathematical Modeling of Weld Bead Geometry, Quality, and Productivity for Stainless Steel Claddings Deposited by FCAW” (J. Mater. Engr. Perform., 2012: 1862–1872) in vestigated how y 5 deposition rate was influenced by x1 = feed rate (Wf , in m/min) and x2 = welding speed (S, in cm/min). The following 22 observations correspond to the experiment condition where applied voltage was less than 30v: y: 2.718 3.881 2.773 3.924 2.740 3.870 x1 : 17.0 10.0 7.0 10.0 7.0 10.0 x 2 : 30 30 50 50 30 30 y: 2.847 3.901 2.204 4.454 3.324 3.319 x1 : 7.0 10.0 5.5 11.5 8.5 8.5 x2 : 50 50 40 40 40 20 The whole data and Question parts are attachedarrow_forward
 MATLAB: An Introduction with ApplicationsStatisticsISBN:9781119256830Author:Amos GilatPublisher:John Wiley & Sons Inc
 Probability and Statistics for Engineering and th...StatisticsISBN:9781305251809Author:Jay L. DevorePublisher:Cengage Learning
 Statistics for The Behavioral Sciences (MindTap C...StatisticsISBN:9781305504912Author:Frederick J Gravetter, Larry B. WallnauPublisher:Cengage Learning
 Elementary Statistics: Picturing the World (7th E...StatisticsISBN:9780134683416Author:Ron Larson, Betsy FarberPublisher:PEARSON
 The Basic Practice of StatisticsStatisticsISBN:9781319042578Author:David S. Moore, William I. Notz, Michael A. FlignerPublisher:W. H. Freeman
 Introduction to the Practice of StatisticsStatisticsISBN:9781319013387Author:David S. Moore, George P. McCabe, Bruce A. CraigPublisher:W. H. Freeman