
Statistics for Engineers and Scientists
4th Edition
ISBN: 9780073401331
Author: William Navidi Prof.
Publisher: McGraw-Hill Education
expand_more
expand_more
format_list_bulleted
Concept explainers
Videos
Textbook Question
Chapter 9.5, Problem 5E
The article cited in Exercise 4 also investigated the effects of the factors on glucose consumption (in g/L). A single measurement is provided for each combination of factors (in the article, there was some replication). The results are presented in the following table.
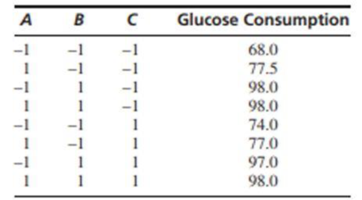
- a. Compute estimates of the main effects and the interactions.
- b. Is it possible to compute an error sum of squares? Explain.
- c. Are any of the interactions among the larger effects? If so, which ones?
- d. Assume that it is known from past experience that the additive model holds. Add the sums of squares for the interactions, and use that result in place of an error sum of squares to test the hypotheses that the main effects are equal to 0.
Expert Solution & Answer
Want to see the full answer?
Check out a sample textbook solution
Chapter 9 Solutions
Statistics for Engineers and Scientists
Ch. 9.1 - A study is made of the effect of curing...Ch. 9.1 - The article Nutrient Deprivation Improves Field...Ch. 9.1 - Prob. 3ECh. 9.1 - The antibiotic gentamicin sulphate is often...Ch. 9.1 - The article influence of Age on Masonry Bond...Ch. 9.1 - Archaeologists can determine the diets of ancient...Ch. 9.1 - The article Secretion of Parathyroid Hormone...Ch. 9.1 - The article Impact of Free Calcium Oxide Content...Ch. 9.1 - A certain chemical reaction was run three times at...Ch. 9.1 - An experiment to compare the lifetimes of four...
Ch. 9.1 - Prob. 11ECh. 9.1 - Prob. 12ECh. 9.1 - Prob. 13ECh. 9.1 - Prob. 14ECh. 9.1 - Refer to Exercise 12. a. Compute the quantity...Ch. 9.1 - Prob. 16ECh. 9.1 - Prob. 17ECh. 9.1 - Prob. 18ECh. 9.1 - Prob. 19ECh. 9.1 - The following MINITAB output presents a power...Ch. 9.2 - Exercises for Section 9.2 1.The article Organic...Ch. 9.2 - The article Optimum Design of an A-pillar Trim...Ch. 9.2 - Prob. 3ECh. 9.2 - Refer to Exercise 2 in Section 9.1. a.Use the...Ch. 9.2 - Refer to Exercise 13 in Section 9.1. a. Use the...Ch. 9.2 - Refer to Exercise 1 in Section 9.1. A scientist...Ch. 9.2 - Refer to Exercise 13 in Section 9.1. A...Ch. 9.2 - Refer to Exercise 3 in Section 9.1. a. Use the...Ch. 9.2 - Refer to Exercise 5 in Section 9.1. a. Use the...Ch. 9.2 - Refer to Exercise 9 in Section 9.1. a. Use the...Ch. 9.2 - Refer to Exercise 16 in Section 9.1. a. Use the...Ch. 9.2 - Refer to Exercise 18 in Section 9.1. a. Use the...Ch. 9.2 - In an experiment to determine the effect of...Ch. 9.2 - In an experiment to determine the effect of curing...Ch. 9.2 - Prob. 15ECh. 9.2 - For some data sets, the F statistic will reject...Ch. 9.3 - To assess the effect of piston ring type and oil...Ch. 9.3 - A machine shop has three machines used in...Ch. 9.3 - An experiment to determine the effect of mold...Ch. 9.3 - The effect of curing pressure on bond strength was...Ch. 9.3 - The article Change in Creep Behavior of Plexiform...Ch. 9.3 - Prob. 6ECh. 9.3 - Prob. 7ECh. 9.3 - Adding glass panicles to clay brick may improve...Ch. 9.3 - The article Application of Radial Basis Function...Ch. 9.3 - Prob. 10ECh. 9.3 - Prob. 11ECh. 9.3 - The article Anodic Fenton Treatment of Treflan MTF...Ch. 9.3 - Refer to Exercise 12. The treatments with a...Ch. 9.3 - The article Use of Taguchi Methods and Multiple...Ch. 9.3 - The article T-Bracing for Stability of Compression...Ch. 9.3 - The article referred to in Exercise 15 also...Ch. 9.3 - Prob. 17ECh. 9.3 - Prob. 18ECh. 9.3 - The article Cellulose Acetate Microspheres...Ch. 9.4 - Recycling newsprint is important in reducing...Ch. 9.4 - A study was done to see which of four machines is...Ch. 9.4 - Prob. 3ECh. 9.4 - Three different corrosion-resistant coatings are...Ch. 9.4 - The article Genotype-Environment Interactions and...Ch. 9.4 - The article Sprinkler Technologies, Soil...Ch. 9.4 - The article Bromate Surveys in French Drinking...Ch. 9.4 - The article Multi-objective Scheduling Problems:...Ch. 9.4 - You have been given the task of designing a study...Ch. 9.4 - An engineering professor wants to determine which...Ch. 9.5 - Prob. 1ECh. 9.5 - Give an example of a factorial experiment in which...Ch. 9.5 - Prob. 3ECh. 9.5 - The article Efficient Pyruvate Production by a...Ch. 9.5 - The article cited in Exercise 4 also investigated...Ch. 9.5 - A metal casting process for the production of...Ch. 9.5 - The article An Investigation into the Ball...Ch. 9.5 - In a 2p design with one replicate per treatment,...Ch. 9.5 - Prob. 9ECh. 9.5 - Prob. 10ECh. 9.5 - The article Factorial Design for Column Rotation...Ch. 9.5 - Prob. 12ECh. 9.5 - Prob. 13ECh. 9 - The article Gypsum Effect on the Aggregate Size...Ch. 9 - Prob. 2SECh. 9 - Prob. 3SECh. 9 - Prob. 4SECh. 9 - Prob. 5SECh. 9 - Prob. 6SECh. 9 - Prob. 7SECh. 9 - The article Case Study Based Instruction of DOE...Ch. 9 - The article Combined Analysis of Real-Time...Ch. 9 - Vermont maple sugar producers sponsored a testing...Ch. 9 - Prob. 11SECh. 9 - Prob. 12SECh. 9 - Prob. 13SECh. 9 - The article Enthalpies and Entropies of Transfer...Ch. 9 - Prob. 15SECh. 9 - Prob. 16SECh. 9 - The article Factorial Experiments in the...Ch. 9 - The Williamsburg Bridge is a suspension bridge...Ch. 9 - Prob. 19SECh. 9 - In the article Nitrate Contamination of Alluvial...Ch. 9 - The article Factorial Experiments in the...Ch. 9 - Prob. 22SECh. 9 - Prob. 23SECh. 9 - Prob. 24SE
Additional Math Textbook Solutions
Find more solutions based on key concepts
Develop a spreadsheet for computing the demand for any values of the input variables in the linear demand and n...
Business Analytics
Testing Hypotheses. In Exercises 13-24, assume that a simple random sample has been selected and test the given...
Elementary Statistics Using the TI-83/84 Plus Calculator, Books a la Carte Edition (4th Edition)
Teacher Salaries
The following data from several years ago represent salaries (in dollars) from a school distri...
Elementary Statistics: A Step By Step Approach
In Hamilton County, Ohio, the mean number of days needed to sell a house is 86 days (Cincinnati Multiple Listin...
STATISTICS F/BUSINESS+ECONOMICS-TEXT
In a test of the quality of two television commercials, each commercial was shown in a separate test area six t...
Statistics for Business & Economics, Revised (MindTap Course List)
Compare and contrast the nonscientific methods for knowing or acquiring knowledge (tenacity, intuition, authori...
Research Methods for the Behavioral Sciences (MindTap Course List)
Knowledge Booster


Learn more about
Need a deep-dive on the concept behind this application? Look no further. Learn more about this topic, statistics and related others by exploring similar questions and additional content below.Similar questions
- For the following table of data. x 1 2 3 4 5 6 7 8 9 10 y 0 0.5 1 2 2.5 3 3 4 4.5 5 a. draw a scatterplot. b. calculate the correlation coefficient. c. calculate the least squares line and graph it on the scatterplot. d. predict the y value when x is 11.arrow_forwardUrban Travel Times Population of cities and driving times are related, as shown in the accompanying table, which shows the 1960 population N, in thousands, for several cities, together with the average time T, in minutes, sent by residents driving to work. City Population N Driving time T Los Angeles 6489 16.8 Pittsburgh 1804 12.6 Washington 1808 14.3 Hutchinson 38 6.1 Nashville 347 10.8 Tallahassee 48 7.3 An analysis of these data, along with data from 17 other cities in the United States and Canada, led to a power model of average driving time as a function of population. a Construct a power model of driving time in minutes as a function of population measured in thousands b Is average driving time in Pittsburgh more or less than would be expected from its population? c If you wish to move to a smaller city to reduce your average driving time to work by 25, how much smaller should the city be?arrow_forward
Recommended textbooks for you
 Linear Algebra: A Modern IntroductionAlgebraISBN:9781285463247Author:David PoolePublisher:Cengage Learning
 Functions and Change: A Modeling Approach to Coll...AlgebraISBN:9781337111348Author:Bruce Crauder, Benny Evans, Alan NoellPublisher:Cengage Learning
 Calculus For The Life SciencesCalculusISBN:9780321964038Author:GREENWELL, Raymond N., RITCHEY, Nathan P., Lial, Margaret L.Publisher:Pearson Addison Wesley,
 Glencoe Algebra 1, Student Edition, 9780079039897...AlgebraISBN:9780079039897Author:CarterPublisher:McGraw Hill
 Big Ideas Math A Bridge To Success Algebra 1: Stu...AlgebraISBN:9781680331141Author:HOUGHTON MIFFLIN HARCOURTPublisher:Houghton Mifflin Harcourt
Linear Algebra: A Modern Introduction
Algebra
ISBN:9781285463247
Author:David Poole
Publisher:Cengage Learning
Functions and Change: A Modeling Approach to Coll...
Algebra
ISBN:9781337111348
Author:Bruce Crauder, Benny Evans, Alan Noell
Publisher:Cengage Learning
Calculus For The Life Sciences
Calculus
ISBN:9780321964038
Author:GREENWELL, Raymond N., RITCHEY, Nathan P., Lial, Margaret L.
Publisher:Pearson Addison Wesley,
Glencoe Algebra 1, Student Edition, 9780079039897...
Algebra
ISBN:9780079039897
Author:Carter
Publisher:McGraw Hill
Big Ideas Math A Bridge To Success Algebra 1: Stu...
Algebra
ISBN:9781680331141
Author:HOUGHTON MIFFLIN HARCOURT
Publisher:Houghton Mifflin Harcourt
Correlation Vs Regression: Difference Between them with definition & Comparison Chart; Author: Key Differences;https://www.youtube.com/watch?v=Ou2QGSJVd0U;License: Standard YouTube License, CC-BY
Correlation and Regression: Concepts with Illustrative examples; Author: LEARN & APPLY : Lean and Six Sigma;https://www.youtube.com/watch?v=xTpHD5WLuoA;License: Standard YouTube License, CC-BY