
Videos
The article “Sprinkler Technologies, Soil Infiltration, and Runoff” (D. DeBoer and S. Chu, Journal of Irrigation and Drainage Engineering. 2001:234–239) presents a study of the runoff depth (in mm) for various sprinkler types. Each of four sprinklers was tested on each of four days, with two replications per day (there were three replications on a few of the days: these are omitted). It is of interest to determine whether runoff depth varies with sprinkler type: variation from one day to another is not of interest. The data are presented in the following table.
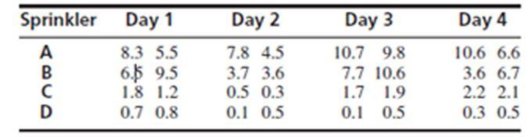
- a. Identify the blocking factor and the treatment factor.
- b. Construct an ANOVA table. You may give
ranges for the P-values. - c. Are the assumptions of a randomized complete block design met? Explain.
- d. Can you conclude that there are differences in
mean runoff depth between some pairs of sprinklers? Explain. - e. Which pairs of sprinklers, if any, can you conclude, at the level, to have differing mean runoff depths?
Want to see the full answer?
Check out a sample textbook solution
Chapter 9 Solutions
Statistics for Engineers and Scientists
Additional Math Textbook Solutions
Intro Stats, Books a la Carte Edition (5th Edition)
Elementary Statistics (13th Edition)
Fundamentals of Statistics (5th Edition)
Statistical Techniques in Business and Economics
Elementary Statistics: Picturing the World (7th Edition)
Statistics: Informed Decisions Using Data (5th Edition)


- The article "Effect of Refrigeration on the Potassium Bitartrate Stability and Composition of Italian Wines" (A. Versari, D. Barbanti, et al., Italian Journal of Food Science, 2002:45- 52) reports a study in which eight types of white wine had their tartaric acid concentration (in g/L) measured both before and after a cold stabilization process. The results are presented in the following table: Wine Type Before After Difference 2.86 2.59 0.27 2.85 2.47 0.38 3 1.84 1.58 0.26 4 1.60 1.56 0.04 0.80 0.78 0.02 6. 0.89 0.66 0.23 2.03 1.87 0.16 1.90 1.71 0.19 Find a 95% confidence interval for the mean difference between the tartaric acid concentrations before and after the cold stabilization process.arrow_forwardThe article "Hydrogeochemical Characteristics of Groundwater in a Mid-Western Coastal Aquifer System" (S. Jeen, J. Kim, et al., Geosciences Journal, 2001:339-348) presents measurements of various properties of shallow groundwater in a certain aquifer system in Korea. Following are measurements of electrical conductivity (in microsiemens per centimeter) for 23 water samples. 2099 528 2030 1350 1018 384 1499 1265 375 424 789 810 522 513 488 200 215 486 257 557 260 461 500 a) Find the mean, median, mode, and standard deviation. b) Construct a histogram using relative frequency on the y-axis and comment on the shape of the distribution.arrow_forwardDetermine the kurtosis if the data given is a sample.arrow_forward
- The article “Models for Assessing Hoisting Times of Tower Cranes” (A. Leung and C. Tam, Journal of Construction Engineering and Management, 1999: 385–391) presents a model constructed by a stepwise regression procedure to predict the time needed for a tower crane hoisting operation. Twenty variables were considered, and the stepwise procedure chose a nine-variable model. The adjusted R2 for the selected model was 0.73. True or false: a) The value 0.73 is a reliable measure of the goodness of fit of the selected model. b) The value 0.73 may exaggerate the goodness of fit of the model. c) A stepwise regression procedure selects only variables that are of some use in predicting the value of the dependent variable. d) It is possible for a variable that is of no use in predicting the value of a dependent variable to be part of a model selected by a stepwise regression procedure.arrow_forwardA study was conducted to examine the effect of diet cola consumption on calcium levels in women. A sample of 16 healthy women aged 18 to 40 were randomly assigned to drink 24 ounces of either diet cola or water. Their urine was collected for three hours after ingestion of the beverage and calcium excretion (in mg) was measured. The data are stored in ColaCalcium.arrow_forwardThe article "Hydrogeochemical Characteristics of Groundwater in a Mid-Western Coastal Aquifer System" (S. Jeen, J. Kim, et al., Geosciences Journal, 2001:339–348) presents measurements of various properties of shallow groundwater in a certain aquifer system in Korea. Following are measurements of electrical conductivity (in microsiemens per centimeter) for 23 water samples. 2099 528 2030 1350 1018 384 1499 522 557 1265 375 424 789 810 513 488 200 215 486 257 260 461 500 a. Find the mean. ъ. Find the standard deviation. C. Find the median. d. Construct a dotplot. e. Find the 10% trimmed mean. Find the first quartile. Find the third quartile. Find the interquartile range. Construct a boxplot. f. g- h. i. j. Which of the points, if any, are outliers? k. If a histogram were constructed, would it be skewed to the left, skewed to the right, or approximately symmetric?arrow_forward
- The article “Hydrogeochemical Characteristics of Groundwater in a Mid-Western CoastalAquifer System” (S. Jeen, J. Kim, et al., Geosciences Journal, 2001:339–348) presentsmeasurements of various properties of shallow groundwater in a certain aquifer system inKorea. Following are measurements of electrical conductivity (in microsiemens percentimeter) for 23 water samples.2099 528 2030 1350 1018 384 14991265 375 424 789 810 522 513488 200 215 486 257 557 260461 500Find the mean.Find the standard deviation.Find the median.Construct a dotplot.Find the 10% trimmed mean.Find the first quartile.Find the third quartile.Find the interquartile range.Construct a boxplot.Which of the points, if any, are outliers?If a histogram were constructed, would it be skewed to the left, skewed to the right, orapproximately symmetric?arrow_forwardTwo subspecies of dark-eyed juncos were studied by D. Cristol et al. One of the sub- species migrates each year, and the other does not. Several characteristics of 14 birds of each subspecies were measured, one of which was wing length. The following data, based on the results of the researchers, provide the wing lengths, in millimeters, for the samples of two subspecies. Assume that wing lengths in populations of subspecies are normally distributed.Migratory: n = 14, x ̄ = 82.1, s = 1.5 111Non-migratory: n = 14, x ̄ = 84.92, s = 1.69 222Conduct a hypothesis test to determine if the average wing lengths in two populations of subspecies are significantly different.(i.) State the hypotheses.(ii.) Test for equality of unknown population variances. (iii.) Calculate test statistic.(iv.) Calculate degrees of freedom.(v.) Calculate the p−value of the test.(vi.) State your decision based on the p−value.(vii.) Write the interpretationarrow_forwardThe article “Effects of Diets with Whole Plant-Origin Proteins Added with Different Ratiosof Taurine:Methionine on the Growth, Macrophage Activity and Antioxidant Capacity ofRainbow Trout (Oncorhynchus mykiss) Fingerlings” (O. Hernandez, L. Hernandez, et al.,Veterinary and Animal Science, 2017:4-9) reports that a sample of 210 juvenile rainbowtrout fed a diet fortified with equal amounts of the amino acids taurine and methionine for aperiod of 70 days had a mean weight gain of 313 percent with a standard deviation of 25, while 210 fish fed with a control diet had a mean weight gain of 233 percent with a standard deviation of 19. Units are percent. Find a 99% confidence interval for the difference in weight gain on the two diets.arrow_forward
- Wild irises are beautiful flowers found throughout the United States, Canada, and northern Europe. This problem concerns the length of the sepal (leaf-like part covering the flower) of different species of wild iris. Data are based on information taken from an article by R. A. Fisher in Annals of Eugenics (Vol. 7, part 2, pp. 179 -188). Measurements of sepal length in centimeters from random samples of Iris setosa (I), Iris versicolor (II), and Iris virginica (III) are as follows below. I II III 5.7 5.1 6.5 4.7 6.2 5.1 4.7 6.6 4.7 5.8 4.9 7.5 4.6 5.2 5.3 5.3 6.2 6.2 5.4 5.8 6.4 (b) Find SSTOT, SSBET, and SSW and check that SSTOT = SSBET + SSW. (Use 3 decimal places.) SSTOT = SSBET = SSW = Find d.f.BET, d.f.W, MSBET, and MSW. (Use 4 decimal places for MSBET, and MSW.) dfBET = dfW = MSBET = MSW = Find the value of the sample F statistic. (Use 2 decimal places.)What are the degrees of freedom? (numerator) (denominator)arrow_forwardWild irises are beautiful flowers found throughout the United States, Canada, and northern Europe. This problem concerns the length of the sepal (leaf-like part covering the flower) of different species of wild iris. Data are based on information taken from an article by R. A. Fisher in Annals of Eugenics (Vol. 7, part 2, pp. 179 -188). Measurements of sepal length in centimeters from random samples of Iris setosa (I), Iris versicolor (II), and Iris virginica (III) are as follows below. I II III 5.9 5.8 6.9 4.8 6.5 5.6 4.6 6.4 4.9 5.7 4.3 7.7 4.8 5.8 5.6 5.4 6.3 6.3 5.8 5.5 6.6 Shall we reject or not reject the claim that there are no differences among the population means of sepal length for the different species of iris? Use a 5% level of significance. (b) Find SSTOT, SSBET, and SSW and check that SSTOT = SSBET + SSW. (Use 3 decimal places.) SSTOT = SSBET = SSW = Find d.f.BET, d.f.W, MSBET, and MSW. (Use 4 decimal places for MSBET, and…arrow_forwardWild irises are beautiful flowers found throughout the United States, Canada, and northern Europe. This problem concerns the length of the sepal (leaf-like part covering the flower) of different species of wild iris. Data are based on information taken from an article by R. A. Fisher in Annals of Eugenics (Vol. 7, part 2, pp. 179 -188). Measurements of sepal length in centimeters from random samples of Iris setosa (I), Iris versicolor (II), and Iris virginica (III) are as follows below. I II III 5.5 5.2 6.8 4.6 6.5 5.3 5.1 6.1 4.4 5.5 4.1 7.9 4.1 5.1 5.9 5.4 6.1 6.9 5.4 5.1 6.6 Shall we reject or not reject the claim that there are no differences among the population means of sepal length for the different species of iris? Use a 5% level of significance. (a) What is the level of significance?State the null and alternate hypotheses. Ho: ?1 = ?2 = ?3; H1: Exactly two means are equal.Ho: ?1 = ?2 = ?3; H1: Not all the means are equal. Ho: ?1 = ?2 = ?3; H1:…arrow_forward
 Calculus For The Life SciencesCalculusISBN:9780321964038Author:GREENWELL, Raymond N., RITCHEY, Nathan P., Lial, Margaret L.Publisher:Pearson Addison Wesley,