
Videos
In the article “Nitrate Contamination of Alluvial Groundwaters in the Nakdong River Basin, Korea” (J. Min, S. Yun. et al., Geosciences Journal. 2002:35–46), several chemical properties were measured for water samples taken from irrigation wells at three locations. The following table presents the means, standard deviations, and
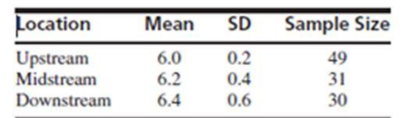
Do the data prove conclusively that the pH differs at the different locations?
Want to see the full answer?
Check out a sample textbook solution
Chapter 9 Solutions
Statistics for Engineers and Scientists
Additional Math Textbook Solutions
Statistics: The Art and Science of Learning from Data (4th Edition)
Elementary Statistics (13th Edition)
Elementary Statistics Using The Ti-83/84 Plus Calculator, Books A La Carte Edition (5th Edition)
STATS:DATA+MODELS-W/DVD
Statistics for Psychology
Elementary Statistics Using Excel (6th Edition)


- Following are measurements of soil concentrations (in mg /kg) of chromium (Cr) and nickel (Ni) at20 sites in the area of Cleveland, Ohio. These data are taken from the article "Variation in NorthAmerican Regulatory Guidance for Heavy Metal Surface Soil Contamination at Commercial andIndustrial Sites" (A. Jennings and J. Ma, J. Environment Eng, 2007:587-609).Cr: 260 19 36 247 263 319 317 277 319 264 23 29 61 119 33 281 21 35 64 30Ni: 435 377 359 53 38 38 54 188 397 33 92 490 28 35 799 347 321 32 74 508 (d) Use these to construct comparative boxplots for the two sets of concentrations. (e) Using the boxplots, what differences can be seen between the two sets of concentrations?arrow_forwardFoot ulcers are a common problem for people with diabetes. Higher skin temperatures on the foot indicate an increased risk of ulcers. The article "An Intelligent Insole for Diabetic Patients with the Loss of Protective Sensation" (Kimberly Anderson, M.S. Thesis, Colorado School of Mines), reports measurements of temperatures, in °F, of both feet for 181 diabetic patients. The results are presented in the following table. Left Foot Right Foot 80 80 85 85 75 80 88 86 89 87 87 82 78 78 88 89 89 90 76 81 89 86 87 82 78 78 80 81 87 82 86 85 76 80 88 89 Construct a scatterplot of the right foot temperature (y) versus the left foot temperature (x). Verify that a linear model is appropriate. b. Compute the least-squares line for predicting the right foot temperature from the left foot temperature. If the left foot temperatures of two patients differ by 2 degrees, by how much would you predict their right foot temperatures to differ? Predict the right foot temperature for a patient whose left…arrow_forwardIn the article “Groundwater Electromagnetic Imaging in Complex Geological and Topographical Regions: A Case Study of a Tectonic Boundary in the French Alps” (S. Houtot, P. Tarits, et al., Geophysics, 2002:1048–1060), the pH was measured for several water samples in various locations near Gittaz Lake in the French Alps. The results for 11 locations on the northern side of the lake and for 6 locations on the southern side are as follows: Northern side: 8.1 8.2 8.1 8.2 8.2 7.4 7.3 7.4 8.1 8.1 7.9 Southern side: 7.8 8.2 7.9 7.9 8.1 8.1 Find a 98% confidence interval for the difference in pH between the northern and southern side.arrow_forward
- 2. The 2 data sets are replicates of pH values of an alkaline solution (set A) and acidic solution (set B). (1) which is more precise? (2) which is more accurate? 11.2, 10.7, 10.9, 11.3, 11.5, 10.5, 10.8, 11.1, 11.2, 11.0 (x, = 10.7) B) 5.2, 6.0, 5.2, 5.9, 6.1, 5.5, 5.8, 5.7, 5-7, 6.o (x = 5.8) %3Darrow_forwardThe authors of the paper "Statistical Methods for Assessing Agreement Between Two Methods of Clinical Measurement"† compared two different instruments for measuring a person's ability to breathe out air. (This measurement is helpful in diagnosing various lung disorders.) The two instruments considered were a Wright peak flow meter and a mini-Wright peak flow meter. Seventeen people participated in the study, and for each person air flow was measured once using the Wright meter and once using the mini-Wright meter. Subject Mini-WrightMeter WrightMeter Subject Mini-WrightMeter WrightMeter 1 512 494 10 445 433 2 430 395 11 432 417 3 520 516 12 626 656 4 428 434 13 260 267 5 500 476 14 477 478 6 600 557 15 259 178 7 364 413 16 350 423 8 380 442 17 451 427 9 658 650 (a) Suppose that the Wright meter is considered to provide a better measure of air flow, but the mini-Wright meter is easier to transport and to use. If the two types of meters produce different…arrow_forwardThe article "Characteristics and Trends of River Discharge into Hudson, James, and Ungava Bays, 1964-2000" (S. Dery, M. Stieglitz, et al., Journal of Climate, 2005:2540-2557) presents measurements of discharge rate x (in kmlyr) andpeakflow y (in m/s) for 42 rivers that drain into the Hudson, James, and Ungava Bays. The data are shown in the following table: Discharge Peak Flow 94.24 4110.3 66.57 4961.7 59.79 10275.5 48.52 6616.9 40.00 7459.5 32.30 2784.4 31.20 3266.7 30.69 4368.7 26.65 1328.5 22.75 4437.6 21.20 1983.0 20.57 1320.1 19.77 1735.7 18.62 1944.1 17.96 3420.2 17.84 2655.3 16.06 3470.3 1561.6 14.69 11.63 869.8 11.19 936.8 11.08 1315.7 10.92 1727.1 9.94 768.1 7.86 483.3arrow_forward
- The authors of the paper "Statistical Methods for Assessing Agreement Between Two Methods of Clinical Measurement"† compared two different instruments for measuring a person's ability to breathe out air. (This measurement is helpful in diagnosing various lung disorders.) The two instruments considered were a Wright peak flow meter and a mini-Wright peak flow meter. Seventeen people participated in the study, and for each person air flow was measured once using the Wright meter and once using the mini-Wright meter. Subject Mini-WrightMeter WrightMeter Subject Mini-WrightMeter WrightMeter 1 512 494 10 445 433 2 430 395 11 432 417 3 520 516 12 626 656 4 428 434 13 260 267 5 500 476 14 477 478 6 600 557 15 259 178 7 364 413 16 350 423 8 380 442 17 451 427 9 658 650 (a) Suppose that the Wright meter is considered to provide a better measure of air flow, but the mini-Wright meter is easier to transport and to use. If the two types of meters produce…arrow_forwardThe removal of ammoniacal nitrogen is an important aspect of treatment of leachate at landfill sites. The rate of removal (in percent per day) is recorded for several days for each of several treatment methods. The results are presented in the following table. (Based on the article "Removal of Ammoniacal Nitrogen from Landfill Leachate by Irrigation onto Vegetated Treatment Planes," S. Tyrrel, P. Leeds-Harrison, and K. Harrison, Water Research, 2002:291–299.) Treatment Rate of Removal 5.21 4.65 5.59 2.69 7.57 5.16 6.24 5.94 6.41 6.85 9.18 4.94 4.04 3.29 4.52 3.75 Construct an ANOVA table. You may give a range for the P-value. Can you conclude that the treatment methods differ in their rates of removal? a. b. ABCAEarrow_forwardThe authors of the paper "Statistical Methods for Assessing Agreement Between Two Methods of Clinical Measurement" compared two different instruments for measuring a subject's ability to breathe out air.† (This measurement is helpful in diagnosing various lung disorders.) The two instruments considered were a Wright peak flow meter and a mini-Wright peak flow meter. Seventeen subjects participated in the study, and for each subject air flow was measured once using the Wright meter and once using the mini-Wright meter. Subject 1 2 3 4 5 6 7 8 9 Mini- Wright Meter 512 430 520 428 500 600 364 380 658 Wright Meter + 494 395 516 434 476 557 413 442 650 Subject 10 11 12 13 14 15 16 17 Mini- Wright Meter 445 432 626 260 477 259 350 451 Wright Meter 433 417 656 267 478 178 423 427 (a) Suppose that the Wright meter is considered to provide a better measure of air flow, but the mini-Wright meter is easier to transport and to use. If the two types of meters produce different readings but there is…arrow_forward
- The article "Electrical Impedance Variation with Water Saturation in Rock" (Q. Su, Q. Feng, and Z. Shang, Geophysics, 2000:68–75) reports measurements of permeabilities (in 10-3um?), porosities (in percent), and surface area per unit volume of pore space (in 104 cm -1) for several rock samples. The results are presented in the following table, denoting In Permeability by y, porosity by x1, and surface area per unit volume by x2. y -0.27 х, 19.83 X2 9.55 2.58 17.93 10.97 3.18 21.27 31.02 1.70 18.67 28.12 -1.17 7.98 52.35 -0.27 10.16 32.82 17.86 13.48 -0.53 57.66 -0.29 21.10 4.94 17.49 9.15 1.94 14.18 11.72 3.74 23.88 5.43 0.58 10.52 20.03 -0.56 18.92 13.10 -0.49 18.55 12.78 -0.01 13.72 40.28 -1.71 9.12 53.67 14.39 11.38 -0.12 26.75 -0.92 75.62 2.18 16.59 9.95 4.46 16.77 7.88 2.11 18.55 88.10 -0.04 18.02 10.95 Fit the model y = 6, + B,X1 + B>x2 + B3x;xX2 + ɛ. Compute the analysis of variance table. a. b. Fit the model y = Bo + B;X1 + B2X2 + ɛ. Compute the analysis of variance table. c.…arrow_forwardThe article “Snow Cover and TemperatureRelationships in North America and Eurasia” (J.Climate and Applied Meteorology, 1983: 460–469) usedstatistical techniques to relate the amount of snow coveron each continent to average continental temperature.Data presented there included the following ten observationson October snow cover for Eurasia during the years1970–1979 (in million km2):6.5 12.0 14.9 10.0 10.7 7.9 21.9 12.5 14.5 9.2What would you report as a representative, or typical,value of October snow cover for this period, and whatprompted your choice?arrow_forwardThe authors of the paper "Statistical Methods for Assessing Agreement Between Two Methods of Clinical Measurement" compared two different instruments for measuring a subject's ability to breathe out air.† (This measurement is helpful in diagnosing various lung disorders.) The two instruments considered were a Wright peak flow meter and a mini-Wright peak flow meter. Seventeen subjects participated in the study, and for each subject air flow was measured once using the Wright meter and once using the mini-Wright meter. Subject Mini-WrightMeter WrightMeter Subject Mini-WrightMeter WrightMeter 1 512 494 10 445 433 2 430 395 11 432 417 3 520 516 12 626 656 4 428 434 13 260 267 5 500 476 14 477 478 6 600 557 15 259 178 7 364 413 16 350 423 8 380 442 17 451 427 9 658 650 (a) Suppose that the Wright meter is considered to provide a better measure of air flow, but the mini-Wright meter is easier to transport and to use. If the two types of meters produce…arrow_forward
 MATLAB: An Introduction with ApplicationsStatisticsISBN:9781119256830Author:Amos GilatPublisher:John Wiley & Sons Inc
 Probability and Statistics for Engineering and th...StatisticsISBN:9781305251809Author:Jay L. DevorePublisher:Cengage Learning
 Statistics for The Behavioral Sciences (MindTap C...StatisticsISBN:9781305504912Author:Frederick J Gravetter, Larry B. WallnauPublisher:Cengage Learning
 Elementary Statistics: Picturing the World (7th E...StatisticsISBN:9780134683416Author:Ron Larson, Betsy FarberPublisher:PEARSON
 The Basic Practice of StatisticsStatisticsISBN:9781319042578Author:David S. Moore, William I. Notz, Michael A. FlignerPublisher:W. H. Freeman
 Introduction to the Practice of StatisticsStatisticsISBN:9781319013387Author:David S. Moore, George P. McCabe, Bruce A. CraigPublisher:W. H. Freeman