
Videos
The article “Bromate Surveys in French Drinking Waterworks” (B. Legube, B. Parinet, et al., Ozone Science and Engineering, 2002:293–304) presents measurements of bromine concentrations (in μg/L) at several waterworks. The measurements made at 15 different times at each of four waterworks are presented in the following table. (The article also presented some additional measurements made at several other waterworks.) It is of interest to determine whether bromine concentrations vary among waterworks: it is not of interest to determine whether concentrations vary over time.
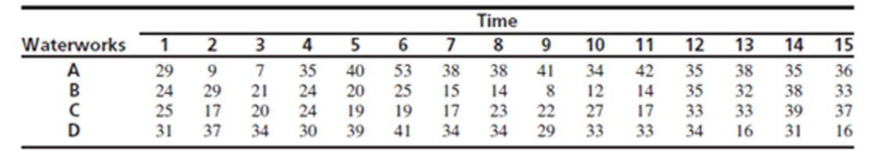
- a. Construct an ANOVA table. You may give
ranges for the P-values. - b. Can you conclude that bromine concentration varies among waterworks?
- c. Which pairs of waterworks, if any, can you conclude, at the 5% level, to have differing bromine concentrations?
- d. Someone suggests that these data could have been analyzed with a one-way ANOVA, ignoring the time factor, with 15 observations for each of the four waterworks. Does the ANOVA table support this suggestion? Explain.
Want to see the full answer?
Check out a sample textbook solution
Chapter 9 Solutions
Statistics for Engineers and Scientists
Additional Math Textbook Solutions
Introduction to Statistical Quality Control
STATISTICS F/BUSINESS+ECONOMICS-TEXT
Elementary Statistics: Picturing the World (6th Edition)
STATS:DATA+MODELS-W/DVD
Statistics for Business & Economics, Revised (MindTap Course List)
APPLIED STAT.IN BUS.+ECONOMICS


- Soil samples were collected at two areas surrounding an abandoned mine and analyzed for lead. At each area several samples were taken. The soil was extracted with acid, and the extract was analyzed using flame atomic absorption spectrometry. In Area A, Pb concentrations were 1.2, 1.0, 0.9, 1.4 mg/kg. In Area B, Pb concentrations were 0.7, 1.0, 0.5, 0.6, 0.4 mg/kg. Are these two areas significantly different from each other with Pb concentrations at 90% confidence level?arrow_forwardThe article “Wastewater Treatment Sludge as a Raw Material for the Production of Bacillus thuringiensis Based Biopesticides” (M. Tirado Montiel, R. Tyagi, and J. Valero, Water Research, 2001:3807–3816) presents measurements of total solids, in g/L, for seven sludge specimens. The results (rounded to the nearest gram) are 20, 5, 25, 43, 24, 21, and 32. Assume the distribution of total solids is approximately symmetric. a) Can you conclude that the mean concentration of total solids is greater than 14 g/L? Compute the appropriate test statistic and find the P-value. b) Can you conclude that the mean concentration of total solids is less than 30 g/L? Compute the appropriate test statistic and find the P-value. c) An environmental engineer claims that the mean concentration of total solids is equal to 18 g/L. Can you conclude that the claim is false?arrow_forwardThe sulfate ion concentration in natural water can be determined by measuring the turbidity that results when an excess of BaCl2 is added to a measured quantity of the sample. A turbiditimeter, the instrument used for this analysis, was calibrated with a series of standard Na2SO4 solutions. The following data were obtained for the calibration:arrow_forward
- Following are measurements of soil concentrations (in mg /kg) of chromium (Cr) and nickel (Ni) at20 sites in the area of Cleveland, Ohio. These data are taken from the article "Variation in NorthAmerican Regulatory Guidance for Heavy Metal Surface Soil Contamination at Commercial andIndustrial Sites" (A. Jennings and J. Ma, J. Environment Eng, 2007:587-609). Cr: 260 19 36 247 263 319 317 277 319 264 23 29 61 119 33 281 21 35 64 30Ni: 435 377 359 53 38 38 54 188 397 33 92 490 28 35 799 347 321 32 74 508 (a) Construct a histogram for each set of concentrations. (b) Find the 1st, 2nd and 3rd quartiles for the Cr concentrations (c) Find the 1st, 2nd and 3rd quartiles for the Ni concentrations.arrow_forwardThe paragraph below is the study questions 16-21 d The Board of Transportation and Safety (BTS) wants to examine the safety mechanisms of A, B, and C-class cars. Samples of 7 cars for each of the classes were used. The board members collect the pressure exerted overall on the driver's body during a crash impact test. The BTS wants to see if there if a difference among the 3 classes of cars. Assume alpha of 0.05. What type of statistical test would be appropriate? O Pearson correlation O Multiple linear regression O one-way independent ANOVA O two-way independent ANOVA O simple linear regression QUESTION 17 Which of the following is the correct alternative hypothesis? O at least 2 of the means are different O all of the pairs of means are different O u1 = p2 = p3arrow_forwardFollowing are measurements of soil concentrations (in mg /kg) of chromium (Cr) and nickel (Ni) at20 sites in the area of Cleveland, Ohio. These data are taken from the article "Variation in NorthAmerican Regulatory Guidance for Heavy Metal Surface Soil Contamination at Commercial andIndustrial Sites" (A. Jennings and J. Ma, J. Environment Eng, 2007:587-609).Cr: 260 19 36 247 263 319 317 277 319 264 23 29 61 119 33 281 21 35 64 30Ni: 435 377 359 53 38 38 54 188 397 33 92 490 28 35 799 347 321 32 74 508 (d) Use these to construct comparative boxplots for the two sets of concentrations. (e) Using the boxplots, what differences can be seen between the two sets of concentrations?arrow_forward
- One operation of a mill is to cut pieces of steel into parts that will later be used as the frame for front seats in an automobile. The steel is cut with a diamond saw and requires the resulting parts to be within 10.005 inch of the length specified by the automobile company. Data are collected from a sample of 50 steel parts and are shown in the following table. The measurement reported is the difference in inches between the actual length of the steel part, as measured by a laser measurement device, and the specified length of the steel part. For example, the first value, -0.003, represents a steel part that is 0.003 inch shorter than the specified length. Complete parts a through c Click the icon to view the data table. a. Construct a frequency distribution Difference in Length -0.005 but less than -0.003: -0.003but less than -0.001 -0.001but less than 0.001 0.001but less than 0.003 0.003but less than 0.005 Frequency Difference Between Actual and Specified Lengths 0.002 0 -0.003…arrow_forwardAnalysis of several plant-food preparations for potassium ion yielded the following data:arrow_forward2. Two kinds of bumper guards, six of each kind, were mounted on a certain make of compact car. Each car was then run into a concrete wall at 5 miles per hour and the costs of repairs (in dollars) was recorded. Summary of the data is shown below. n = 6 i = 144 si = 363.20 n =6 i = 149 si = 202.00 Test at the 0.02 level of significance whether it is reasonable to assume that the two populations sampled have equal variances.arrow_forward
- The article "Characteristics and Trends of River Discharge into Hudson, James, and Ungava Bays, 1964-2000" (S. Dery, M. Stieglitz, et al., Journal of Climate, 2005:2540-2557) presents measurements of discharge rate x (in kmlyr) andpeakflow y (in m/s) for 42 rivers that drain into the Hudson, James, and Ungava Bays. The data are shown in the following table: Discharge Peak Flow 94.24 4110.3 66.57 4961.7 59.79 10275.5 48.52 6616.9 40.00 7459.5 32.30 2784.4 31.20 3266.7 30.69 4368.7 26.65 1328.5 22.75 4437.6 21.20 1983.0 20.57 1320.1 19.77 1735.7 18.62 1944.1 17.96 3420.2 17.84 2655.3 16.06 3470.3 1561.6 14.69 11.63 869.8 11.19 936.8 11.08 1315.7 10.92 1727.1 9.94 768.1 7.86 483.3arrow_forwardQuestion 12 µ±30 covers 95% of the items in a data set. A) True B) Falsearrow_forwardThe amount of pollution produced by cars was measured for cars using gasoline containing different amounts of lead. A. Independent B. Dependentarrow_forward
 MATLAB: An Introduction with ApplicationsStatisticsISBN:9781119256830Author:Amos GilatPublisher:John Wiley & Sons Inc
 Probability and Statistics for Engineering and th...StatisticsISBN:9781305251809Author:Jay L. DevorePublisher:Cengage Learning
 Statistics for The Behavioral Sciences (MindTap C...StatisticsISBN:9781305504912Author:Frederick J Gravetter, Larry B. WallnauPublisher:Cengage Learning
 Elementary Statistics: Picturing the World (7th E...StatisticsISBN:9780134683416Author:Ron Larson, Betsy FarberPublisher:PEARSON
 The Basic Practice of StatisticsStatisticsISBN:9781319042578Author:David S. Moore, William I. Notz, Michael A. FlignerPublisher:W. H. Freeman
 Introduction to the Practice of StatisticsStatisticsISBN:9781319013387Author:David S. Moore, George P. McCabe, Bruce A. CraigPublisher:W. H. Freeman