
Statistics for Engineers and Scientists
4th Edition
ISBN: 9780073401331
Author: William Navidi Prof.
Publisher: McGraw-Hill Education
expand_more
expand_more
format_list_bulleted
Videos
Textbook Question
Chapter 8.1, Problem 1E
In an experiment to determine the factors affecting tensile strength in steel plates, the tensile strength (in kg/mm2), the manganese content (in parts per thousand), and the thickness (in mm) were measured for a sample of 20 plates. The following MINITAB output presents the results of fitting the model Tensile strength = β0 + β1 Manganese + β2 Thickness.
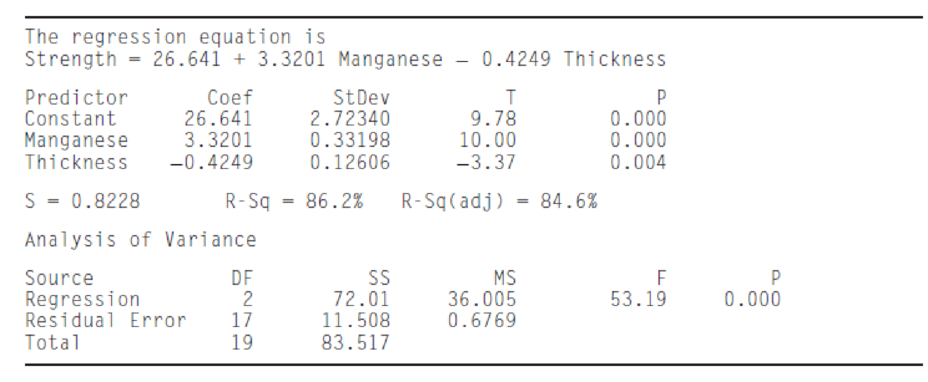
- a. Predict the strength for a specimen that is 10 mm thick and contains 8.2 ppt manganese.
- b. If two specimens have the same thickness, and one contains 10 ppt more manganese, by how much would you predict their strengths to differ?
- c. If two specimens have the same proportion of manganese, and one is 5 mm thicker than the other, by how much would you predict their strengths to differ?
Expert Solution & Answer
Want to see the full answer?
Check out a sample textbook solution
Students have asked these similar questions
Homework Let X1, X2, Xn be a random sample from f(x;0) where
f(x; 0) = (-), 0 < x < ∞,0 € R
Using Basu's theorem, show that Y = min{X} and Z =Σ(XY) are indep.
-
Homework Let X1, X2, Xn be a random sample from f(x; 0) where
f(x; 0) = e−(2-0), 0 < x < ∞,0 € R
Using Basu's theorem, show that Y = min{X} and Z =Σ(XY) are indep.
An Arts group holds a raffle. Each raffle ticket costs $2 and the raffle consists of 2500 tickets. The prize is a vacation worth $3,000.
a. Determine your expected value if you buy one ticket.
b. Determine your expected value if you buy five tickets.
How much will the Arts group gain or lose if they sell all the tickets?
Chapter 8 Solutions
Statistics for Engineers and Scientists
Ch. 8.1 - In an experiment to determine the factors...Ch. 8.1 - Prob. 2ECh. 8.1 - Prob. 3ECh. 8.1 - The article Application of Analysis of Variance to...Ch. 8.1 - Prob. 5ECh. 8.1 - Prob. 6ECh. 8.1 - Prob. 7ECh. 8.1 - Refer to Exercise 7. a. Find a 95% confidence...Ch. 8.1 - In a study of the lung function of children, the...Ch. 8.1 - Prob. 10E
Ch. 8.1 - Prob. 11ECh. 8.1 - The following MINITAB output is for a multiple...Ch. 8.1 - Prob. 13ECh. 8.1 - Prob. 14ECh. 8.1 - Prob. 15ECh. 8.1 - The following data were collected in an experiment...Ch. 8.1 - The November 24, 2001, issue of The Economist...Ch. 8.1 - The article Multiple Linear Regression for Lake...Ch. 8.1 - Prob. 19ECh. 8.2 - In an experiment to determine factors related to...Ch. 8.2 - In a laboratory test of a new engine design, the...Ch. 8.2 - In a laboratory test of a new engine design, the...Ch. 8.2 - The article Influence of Freezing Temperature on...Ch. 8.2 - The article Influence of Freezing Temperature on...Ch. 8.2 - The article Influence of Freezing Temperature on...Ch. 8.3 - True or false: a. For any set of data, there is...Ch. 8.3 - The article Experimental Design Approach for the...Ch. 8.3 - Prob. 3ECh. 8.3 - An engineer measures a dependent variable y and...Ch. 8.3 - Prob. 5ECh. 8.3 - The following MINITAB output is for a best subsets...Ch. 8.3 - Prob. 7ECh. 8.3 - Prob. 8ECh. 8.3 - (Continues Exercise 7 in Section 8.1.) To try to...Ch. 8.3 - Prob. 10ECh. 8.3 - Prob. 11ECh. 8.3 - Prob. 12ECh. 8.3 - The article Ultimate Load Analysis of Plate...Ch. 8.3 - Prob. 14ECh. 8.3 - Prob. 15ECh. 8.3 - Prob. 16ECh. 8.3 - The article Modeling Resilient Modulus and...Ch. 8.3 - The article Models for Assessing Hoisting Times of...Ch. 8 - The article Advances in Oxygen Equivalence...Ch. 8 - Prob. 2SECh. 8 - Prob. 3SECh. 8 - Prob. 4SECh. 8 - In a simulation of 30 mobile computer networks,...Ch. 8 - The data in Table SE6 (page 649) consist of yield...Ch. 8 - Prob. 7SECh. 8 - Prob. 8SECh. 8 - Refer to Exercise 2 in Section 8.2. a. Using each...Ch. 8 - Prob. 10SECh. 8 - The data presented in the following table give the...Ch. 8 - The article Enthalpies and Entropies of Transfer...Ch. 8 - Prob. 13SECh. 8 - Prob. 14SECh. 8 - The article Measurements of the Thermal...Ch. 8 - The article Electrical Impedance Variation with...Ch. 8 - The article Groundwater Electromagnetic Imaging in...Ch. 8 - Prob. 18SECh. 8 - Prob. 19SECh. 8 - Prob. 20SECh. 8 - Prob. 21SECh. 8 - Prob. 22SECh. 8 - The article Estimating Resource Requirements at...Ch. 8 - Prob. 24SE
Knowledge Booster


Learn more about
Need a deep-dive on the concept behind this application? Look no further. Learn more about this topic, statistics and related others by exploring similar questions and additional content below.Similar questions
- Please show as much work as possible to clearly show the steps you used to find each solution. If you plan to use a calculator, please be sure to clearly indicate your strategy. Consider the following game. It costs $3 each time you roll a six-sided number cube. If you roll a 6 you win $15. If you roll any other number, you receive nothing. a) Find the expected value of the game. b) If you play this game many times, will you expect to gain or lose money?arrow_forward= 12:02 WeBWorK / 2024 Fall Rafeek MTH23 D02 / 9.2 Testing the Mean mu / 3 38 WEBWORK Previous Problem Problem List Next Problem 9.2 Testing the Mean mu: Problem 3 (1 point) Test the claim that the population of sophomore college students has a mean grade point average greater than 2.2. Sample statistics include n = 71, x = 2.44, and s = 0.9. Use a significance level of a = 0.01. The test statistic is The P-Value is between : The final conclusion is < P-value < A. There is sufficient evidence to support the claim that the mean grade point average is greater than 2.2. ○ B. There is not sufficient evidence to support the claim that the mean grade point average is greater than 2.2. Note: You can earn partial credit on this problem. Note: You are in the Reduced Scoring Period. All work counts for 50% of the original. Preview My Answers Submit Answers You have attempted this problem 0 times. You have unlimited attempts remaining. . Oli wwm01.bcc.cuny.eduarrow_forwardThere are four white, fourteen blue and five green marbles in a bag. A marble is selected from the bag without looking. Find the odds of the following: The odds against selecting a green marble. The odds in favour of not selecting a green marble The odds in favor of the marble selected being either a white or a blue marble. What is true about the above odds? Explainarrow_forward
- Please show as much work as possible to clearly show the steps you used to find each solution. If you plan to use a calculator, please be sure to clearly indicate your strategy. 1. The probability of a soccer game in a particular league going into overtime is 0.125. Find the following: a. The odds in favour of a game going into overtime. b. The odds in favour of a game not going into overtime. c. If the teams in the league play 100 games in a season, about how many games would you expect to go into overtime?arrow_forwardexplain the importance of the Hypothesis test in a business setting, and give an example of a situation where it is helpful in business decision making.arrow_forwardA college wants to estimate what students typically spend on textbooks. A report fromthe college bookstore observes that textbooks range in price from $22 to $186. Toobtain a 95% confidence level for a confidence interval estimate to plus or minus $10,how many students should the college survey? (We may estimate the populationstandard deviation as (range) ÷ 4.)arrow_forward
- In a study of how students give directions, forty volunteers were given the task ofexplaining to another person how to reach a destination. Researchers measured thefollowing five aspects of the subjects’ direction-giving behavior:• whether a map was available or if directions were given from memory without a map,• the gender of the direction-giver,• the distances given as part of the directions,• the number of times directions such as “north” or “left” were used,• the frequency of errors in directions. Identify each of the variables in this study, and whether each is quantitative orqualitative. For each quantitative variable, state whether it is discrete or continuous. Was this an observational study or an experimental study? Explain your answer.arrow_forwardexplain the difference between the confident interval and the confident level. provide an example to show how to correctly interpret a confidence interval.arrow_forwardSketch to scale the orbit of Earth about the sun. Graph Icarus’ orbit on the same set of axesWhile the sun is the center of Earth’s orbit, it is a focus of Icarus’ orbit. There aretwo points of intersection on the graph. Based on the graph, what is the approximate distance between the two points of intersection (in AU)?arrow_forward
- The diameters of ball bearings are distributed normally. The mean diameter is 67 millimeters and the standard deviation is 3 millimeters. Find the probability that the diameter of a selected bearing is greater than 63 millimeters. Round to four decimal places.arrow_forwardSuppose you like to keep a jar of change on your desk. Currently, the jar contains the following: 22 Pennies 27 Dimes 9 Nickels 30 Quarters What is the probability that you reach into the jar and randomly grab a penny and then, without replacement, a dime? Express as a fraction or a decimal number rounded to four decimal places.arrow_forwardA box contains 14 large marbles and 10 small marbles. Each marble is either green or white. 9 of the large marbles are green, and 4 of the small marbles are white. If a marble is randomly selected from the box, what is the probability that it is small or white? Express as a fraction or a decimal number rounded to four decimal places.arrow_forward
arrow_back_ios
SEE MORE QUESTIONS
arrow_forward_ios
Recommended textbooks for you
 Glencoe Algebra 1, Student Edition, 9780079039897...AlgebraISBN:9780079039897Author:CarterPublisher:McGraw Hill
Glencoe Algebra 1, Student Edition, 9780079039897...
Algebra
ISBN:9780079039897
Author:Carter
Publisher:McGraw Hill
Hypothesis Testing using Confidence Interval Approach; Author: BUM2413 Applied Statistics UMP;https://www.youtube.com/watch?v=Hq1l3e9pLyY;License: Standard YouTube License, CC-BY
Hypothesis Testing - Difference of Two Means - Student's -Distribution & Normal Distribution; Author: The Organic Chemistry Tutor;https://www.youtube.com/watch?v=UcZwyzwWU7o;License: Standard Youtube License