
Videos
The article “Electrical Impedance Variation with Water Saturation in Rock” (Q. Su, Q. Feng, and Z. Shang, Geophysics, 2000:68–75) reports measurements of permeabilities (in 10–3μm2 percent), porosities (in percent), and surface area per unit volume of pore space (in 104 cm–1) for several rock samples. The results are presented in the following table, denoting In Permeability by y. porosity by x1, and surface area per unit volume by x2.
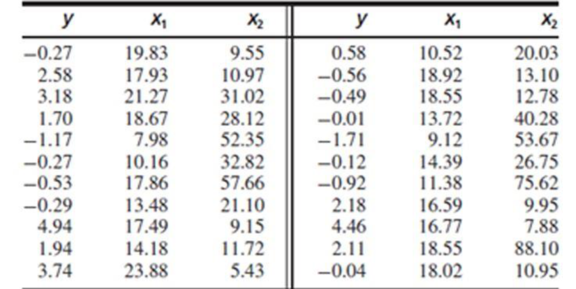
a. Fit the model
b. Fit the model
c. Fit the model
d. Compute the F statistics for comparing the models in parts (b) and (c) with the model in part (a). Which model do you prefer? Why?
Want to see the full answer?
Check out a sample textbook solution
Chapter 8 Solutions
Statistics for Engineers and Scientists
Additional Math Textbook Solutions
Elementary Statistics Using The Ti-83/84 Plus Calculator, Books A La Carte Edition (5th Edition)
Probability and Statistics for Engineering and the Sciences
Elementary Statistics Using the TI-83/84 Plus Calculator, Books a la Carte Edition (4th Edition)
APPLIED STAT.IN BUS.+ECONOMICS
Elementary Statistics Using Excel (6th Edition)
Research Methods for the Behavioral Sciences (MindTap Course List)


- Following are measurements of soil concentrations (in mg /kg) of chromium (Cr) and nickel (Ni) at20 sites in the area of Cleveland, Ohio. These data are taken from the article "Variation in NorthAmerican Regulatory Guidance for Heavy Metal Surface Soil Contamination at Commercial andIndustrial Sites" (A. Jennings and J. Ma, J. Environment Eng, 2007:587-609). Cr: 260 19 36 247 263 319 317 277 319 264 23 29 61 119 33 281 21 35 64 30Ni: 435 377 359 53 38 38 54 188 397 33 92 490 28 35 799 347 321 32 74 508 (a) Construct a histogram for each set of concentrations. (b) Find the 1st, 2nd and 3rd quartiles for the Cr concentrations (c) Find the 1st, 2nd and 3rd quartiles for the Ni concentrations.arrow_forwardRoman, a health data officer, was tasked to create a report describing the height of all the children ages 12-15 years in a small town in Rome. He measured the height of all the 37 children (ages 12-15 years) in that small town. Answer the table showing the number and percentage of children ages 12 to 15 years according to sex. Sex f Rel f Male <2 decimal places> Female <2 decimal places> Σf <2 decimal places>arrow_forwardFollowing are measurements of soil concentrations (in mg /kg) of chromium (Cr) and nickel (Ni) at20 sites in the area of Cleveland, Ohio. These data are taken from the article "Variation in NorthAmerican Regulatory Guidance for Heavy Metal Surface Soil Contamination at Commercial andIndustrial Sites" (A. Jennings and J. Ma, J. Environment Eng, 2007:587-609).Cr: 260 19 36 247 263 319 317 277 319 264 23 29 61 119 33 281 21 35 64 30Ni: 435 377 359 53 38 38 54 188 397 33 92 490 28 35 799 347 321 32 74 508 (d) Use these to construct comparative boxplots for the two sets of concentrations. (e) Using the boxplots, what differences can be seen between the two sets of concentrations?arrow_forward
- Question 12 µ±30 covers 95% of the items in a data set. A) True B) Falsearrow_forwardThe following table summarizes the percentage frequency of admitted students in SQU (2018) Defect code Percentage Frequency Bachelor 0.733 Master 0.206 Postgraduate Diploma 0.044 PhDarrow_forwardQUESTION 2 Table Q2 shows Malaysian basketball players height for 2021 FIBA Asia Cup qualification. a) Calculate the average height of Malaysian basketball players.arrow_forward
- n. ln. N Ciectical Cnyineers GToup as Cv = 40.32 % The following data represent the results obtained from the specific gravity (S.G.) test performed ina soil laboratory including * ?for sand samples. Find the mode Number of Specific Gravity 2.30-2.39 Samples 2.40-2.49 2.50-2.59 4 6. 2.60-2.69 12 2.70-2.79 14 2.80-2.89 2 3.35-3.40 2.10-2.15 2.20-2.25 2.70-2.75 2.80-2.85 2.30-2.35 2,60-2.65 2.40-2,45 2.50-2.55 2.90-2.95 ارفع اجابتك بشكل ملف wdf او صورة 1O 0O 10 O O O O Oarrow_forwardAn experiment was conducted to study the extrusion process of biodegradable packaging foam. Two of the factors considered for their effect on the foam diameter (mm) were the die temperature(145°C vs.155°C) and the die diameter (3 mm vs. 4 mm). The results are in the accompanying data table. The question are attached in a photoarrow_forwardTable 3 shows the number of lung cancer deaths per daily number of cigarettes smoked at the time of completing the 1951 questionnaire (only for male physicians who were nonsmokers and current smokers). The number of cigarettes smoked was available for 136 of the people who died of lung cancer. Number of cigarettes Deaths 3 Person-years 42800 0. 1-14 22 38600 15-24 54 38900 +24 57 25100 a) Estimate the appropriate measure of association and 95% confidence interval for each category of number of cigarettes smoked daily, using the group of non-smokers as the reference category. b) What can be inferred about the estimated measure of association in the different categories of number of cigarettes smoked daily? c) What is the proportion of lung cancer deaths among all smokers that can be attributed smoking? What is the proportion of lung cancer deaths in the total population that can be attributed to smoking? consider thatarrow_forward
- The article "Characteristics and Trends of River Discharge into Hudson, James, and Ungava Bays, 1964-2000" (S. Dery, M. Stieglitz, et al., Journal of Climate, 2005:2540-2557) presents measurements of discharge rate x (in kmlyr) andpeakflow y (in m/s) for 42 rivers that drain into the Hudson, James, and Ungava Bays. The data are shown in the following table: Discharge Peak Flow 94.24 4110.3 66.57 4961.7 59.79 10275.5 48.52 6616.9 40.00 7459.5 32.30 2784.4 31.20 3266.7 30.69 4368.7 26.65 1328.5 22.75 4437.6 21.20 1983.0 20.57 1320.1 19.77 1735.7 18.62 1944.1 17.96 3420.2 17.84 2655.3 16.06 3470.3 1561.6 14.69 11.63 869.8 11.19 936.8 11.08 1315.7 10.92 1727.1 9.94 768.1 7.86 483.3arrow_forwardA study of the amount of rainfall and the quantity of air pollution removed produced the following data shown in table below: Daily Rainfall x (0.01 cm) Particulate Removed y (μg/m3) 7 126 7.9 129.3 7.5 125.3 9.2 120.2 10.8 116.7 5.8 119.2 5.6 138.7 2.7 147.5 9.2 110.3 Compute and interpret the coefficient of determination, and coefficient of correlation for the given data. What will be the regression equation, when swapped depended and independent variablearrow_forwardQ.2. Because of potential variability in aging due to different castings and segments on the castings, a Latin square design with N=7 was used to investigate the effect of heat treatment on aging. With A= castings, B = Σχ = 297,216.90, segments, C = heat treatments, summary statistics include x... = 3815.8, Σχ = 297,155.01, and 297,200.64, = 297,317.65. Obtain the ANOVA table and test at level .05 the hypothesis that heat treatment has no effect on aging.arrow_forward
 MATLAB: An Introduction with ApplicationsStatisticsISBN:9781119256830Author:Amos GilatPublisher:John Wiley & Sons Inc
 Probability and Statistics for Engineering and th...StatisticsISBN:9781305251809Author:Jay L. DevorePublisher:Cengage Learning
 Statistics for The Behavioral Sciences (MindTap C...StatisticsISBN:9781305504912Author:Frederick J Gravetter, Larry B. WallnauPublisher:Cengage Learning
 Elementary Statistics: Picturing the World (7th E...StatisticsISBN:9780134683416Author:Ron Larson, Betsy FarberPublisher:PEARSON
 The Basic Practice of StatisticsStatisticsISBN:9781319042578Author:David S. Moore, William I. Notz, Michael A. FlignerPublisher:W. H. Freeman
 Introduction to the Practice of StatisticsStatisticsISBN:9781319013387Author:David S. Moore, George P. McCabe, Bruce A. CraigPublisher:W. H. Freeman