
Videos
The article “Modeling Resilient Modulus and Temperature Correction for Saudi Roads” (H. Wahhab, I. Asi, and R. Ramadhan, Journal of Materials in Civil Engineering, 2001:298–305) describes a study designed to predict the resilient modulus of pavement from physical properties. The following table presents data for the resilient modulus at 40°C in 106 kPa (y), the surface area of the aggregate in m2/kg (x1), and the softening point of the asphalt in °C (x2).
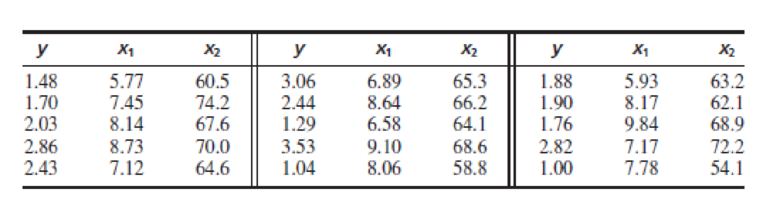
The full quadratic model is
Want to see the full answer?
Check out a sample textbook solution
Chapter 8 Solutions
Statistics for Engineers and Scientists
Additional Math Textbook Solutions
The Practice of Statistics for AP - 4th Edition
EBK STATISTICAL TECHNIQUES IN BUSINESS
Business Analytics
Introduction to Statistical Quality Control
Business Statistics: A First Course (8th Edition)
Elementary Statistics: A Step By Step Approach


- The article "Effect of Granular Subbase Thickness on Airfield Pavement Structural Response" (K. Gopalakrishnan and M. Thompson, Journal of Materials in Civil Engineering, 2008:331-342) presents a study of the amount of surface deflection caused by aircraft landing on an airport runway. A load of 160 kN was applied to a runway surface, and the amount of deflection in mm (y) was measured at various distances in m (x) from the point of application. The results are presented in the following table. y 0.000 3.24 0.305 2.36 0.610 1.42 0.914 0.87 1.219 0.54 1.524 0.34 1.830 0.24 a. Fit the linear model y = Bo + B1x + ɛ. For each coefficient, test the hypothesis that the coefficient is equal to 0. b. Fit the quadratic model y = Bo + Bịx + B2x² + ɛ. For each coefficient, test the hypothesis that the coefficient is equal to 0. %3D Fit the cubic model y = Bo + B1x + B2x? + B3x + E. For each coefficient, test the C. hypothesis that the coefficient is equal to 0. d. Which of the models in parts (a)…arrow_forwardWrinkle recovery angle and tensile strength are the two most important characteristics for evaluating the performance of crosslinked cotton fabric. An increase in the degree of crosslinking, as determined by ester carboxyl band absorbance, improves the wrinkle resistance of the fabric (at the expense of reducing mechanical strength). The accompanying data on x = absorbance and y = wrinkle resistance angle was read from a graph in the paper "Predicting the Performance of Durable Press Finished Cotton Fabric with Infrared Spectroscopy".t 半 0.115 0.126 0.183 0.246 0.282 0.344 0.355 0.452 0.491 0.554 0.651 334 342 355 363 365 372 381 392 400 412 420 Here is regression output from Minitab: Predictor Coef SE Coef P Constant 321.878 2.483 129.64 0.000 absorb 156.711 6.464 24.24 0.000 S = 3.60498 R-Sq = 98.5% R-Są (adj) - 98.3% SOURCE DF MS F P Regression 1 7639.0 7639.0 587.81 0.000 Residual Error 9 117.0 13.0 Total 10 7756.0 (a) Does the simple linear regression model appear to be…arrow_forwardThe following table presents measurements of mean noise levels in dBA (y), roadway width in m (x1), and mean speed in km/h (x2), for 10 locations in Bangkok, Thailand, as reported in the article "Modeling of Urban Area Stop-and-Go Traffic Noise" (P. Pamanikabud and C. Tharasawatipipat, Journal of Transportation Engineering, 1999:152–159). y X1 X2 78.1 6.0 30.61 78.1 10.0 36.55 79.6 12.0 36.22 81.0 6.0 38.73 78.7 6.5 29.07 78.1 12.0 28.26 78.6 6.5 30.28 78.5 6.5 30.25 78.4 9.0 29.03 79.6 6.5 33.17 Construct a good linear model to predict mean noise levels using roadway width, mean speed, or both, as predictors. Provide the standard deviations of the coefficient estimates and the P-values for testing that they are different from 0. Explain how you chose your model.arrow_forward
- Wrinkle recovery angle and tensile strength are the two most important characteristics for evaluating the performance of crosslinked cotton fabric. An increase in the degree of crosslinking, as determined by ester carboxyl band absorbance, improves the wrinkle resistance of the fabric (at the expense of reducing mechanical strength). The accompanying data on x = absorbance and y = wrinkle resistance angle was read from a graph in the paper "Predicting the Performance of Durable Press Finished Cotton Fabric with Infrared Spectroscopy".† x 0.115 0.126 0.183 0.246 0.282 0.344 0.355 0.452 0.491 0.554 0.651 y 334 342 355 363 365 372 381 392 400 412 420 Here is regression output from Minitab: Predictor Constant absorb S = 3.60498 Coef 321.878 156.711 SOURCE Regression Residual Error Total SE Coef 2.483 6.464 R-Sq = 98.5% DF 1 9 10 SS 7639.0 117.0 7756.0 T 129.64 24.24 0.000 0.000 R-Sq (adj) = 98.3% MS 7639.0 13.0 F P 587.81 (a) Does the simple linear regression model appear to be…arrow_forwardThe article "Electrical Impedance Variation with Water Saturation in Rock" (Q. Su, Q. Feng, and Z. Shang, Geophysics, 2000:68–75) reports measurements of permeabilities (in 10-3um?), porosities (in percent), and surface area per unit volume of pore space (in 104 cm -1) for several rock samples. The results are presented in the following table, denoting In Permeability by y, porosity by x1, and surface area per unit volume by x2. y -0.27 х, 19.83 X2 9.55 2.58 17.93 10.97 3.18 21.27 31.02 1.70 18.67 28.12 -1.17 7.98 52.35 -0.27 10.16 32.82 17.86 13.48 -0.53 57.66 -0.29 21.10 4.94 17.49 9.15 1.94 14.18 11.72 3.74 23.88 5.43 0.58 10.52 20.03 -0.56 18.92 13.10 -0.49 18.55 12.78 -0.01 13.72 40.28 -1.71 9.12 53.67 14.39 11.38 -0.12 26.75 -0.92 75.62 2.18 16.59 9.95 4.46 16.77 7.88 2.11 18.55 88.10 -0.04 18.02 10.95 Fit the model y = 6, + B,X1 + B>x2 + B3x;xX2 + ɛ. Compute the analysis of variance table. a. b. Fit the model y = Bo + B;X1 + B2X2 + ɛ. Compute the analysis of variance table. c.…arrow_forwardWrinkle recovery angle and tensile strength are the two most important characteristics for evaluating the performance of crosslinked cotton fabric. An increase in the degree of crosslinking, as determined by ester carboxyl band absorbance, improves the wrinkle resistance of the fabric (at the expense of reducing mechanical strength). The accompanying data on x = absorbance and y = wrinkle resistance angle was read from a graph in the paper "Predicting the Performance of Durable Press Finished Cotton Fabric with Infrared Spectroscopy".t x 0.115 0.126 0.183 0.246 0.282 0.344 0.355 0.452 0.491 0.554 0.651 y 334 342 355 363 365 372 381 400 392 412 420 Here is regression output from Minitab: Predictor Constant absorb S = 3.60498 Coef 321.878 156.711 SOURCE Regression Residual Error Total R-Sq= 98.5% DF SE Coef 2.483 6.464 1 9 10 SS 7639.0 117.0 7756..0 T 129.64 24.24 P 0.000 0.000. R-Sq (adj) 98.3% MS 7639.0 13.0 F 587.81 (a) Does the simple linear regression model appear to be appropriate?…arrow_forward
- Recently there has been increased use of stainless steel claddings in industrial settings. Claddings are used to finish the exterior walls of a building and help weatherproof the structure. To ensure the quality of claddings, it is essential to know how welding parameters impact the cladding process. The authors of “Mathematical Modeling of Weld Bead Geometry, Quality, and Productivity for Stainless Steel Claddings Deposited by FCAW” (J. Mater. Engr. Perform., 2012: 1862–1872) in vestigated how y 5 deposition rate was influenced by x1 = feed rate (Wf , in m/min) and x2 = welding speed (S, in cm/min). The following 22 observations correspond to the experiment condition where applied voltage was less than 30v: y: 2.718 3.881 2.773 3.924 2.740 3.870 x1 : 17.0 10.0 7.0 10.0 7.0 10.0 x 2 : 30 30 50 50 30 30 y: 2.847 3.901 2.204 4.454 3.324 3.319 x1 : 7.0 10.0 5.5 11.5 8.5 8.5 x2 : 50 50 40 40 40 20 The whole data and Question parts are attachedarrow_forwardThe article "Drying of Pulps in Sprouted Bed: Effect of Composition on Dryer Performance" (M. Medeiros, S. Rocha, et al., Drying Technology, 2002:865-881) presents measurements of pH, viscosity (in kg/m - s), density (in g/cm), and BRIX (in percent). The following MINITAB output presents the results of fitting the model pH = 6, +6, Viscosity + B, Density + ß, BRIX +€ The regression equation is pH - -1.79 + 0.000266 Viscosity + 9.82 Density - 0.300 BRIX Predictor Coef SE Coef Constant -1.7914 6.2339 -0.29 0.778 Viscosity 0.00026626 0.00011517 2.31 0.034 Density 9.8184 5.7173 1.72 0.105 BRIX -0.29982 0.099039 -3.03 0.008 S - 0.379578 R-Sq - 50.0% R-Sq(adj) - 40.6% Predicted Values for New Observations New Obs Fit SE Fit 95% CI 95% PI 3.0875 0.1351 (2.8010, 3.3740) (2.2333, 3.9416) (3.4207, 4.0496) (2.3255, 3.3896) 2 3.7351 0.1483 (2.8712, 4.5990) з 2.8576 0.2510 (1.8929, 3.8222) Values of Predictors for New Observations New Obs Viscosity Density BRIX 1000 1.05 19.0 1200 1.08 18.0 2000…arrow_forwardPlease show me your solutions and interpretations. Show the completehypothesis-testing procedure.An article in the ASCE Journal of Energy Engineering (1999, Vol. 125, pp. 59–75) describes a study of the thermal inertia properties of autoclaved aerated concrete used as a building material. Five samples of the material were tested in a structure, and the average interior temperatures (°C) reported were as follows: 23.01, 22.22, 22.04, 22.62, and 22.59. Test that the average interior temperature is equal to 22.5 °C using α = 0.05.arrow_forward
- Q3) An experiment was carried out to investigate variation of solubility of chemical X in water. The quantities in kg that dissolved in 1 liter at various temperatures are show in the table (1). Table (1) Temperature C Mass of X 2.1 2.6 2.9 3.3 15 20 25 30 35 4 50 5.1 70 7 Use the proper methods to answer the following questions: a) Draw a scatter diagram to show the data. b) Estimate the temperature based on the mass of X. c) What quantity might be expected to dissolve at 42 C? Find the quantity that your cquation indicates would dissolve at 10 C and comment on your answer.arrow_forwardFluid inclusions are microscopic volumes of fluid that are trapped in rock during rock formation. The article "Fluid Inclusion Study of Metamorphic Gold-Quartz Veins in Northwestern Nevada, U.S.A.: Characteristics of Tectonically Induced Fluid" (S. Cheong, Geosciences Journal, 2002:103-115) describes the geochemical properties of fluid inclusions in several different veins in northwest Nevada. The following table presents data on the maximum salinity (% NaCi by weight) of inclusions in several rock samples from several areas. Salinity Area Humboldt Range Santa Rosa Range 9.2 10.0 11.2 8.8 5.2 6.1 8.3 Ten Mile 7.9 6.7 9.5 7.3 10.4 7.0 Antelope Range Pine Forest Range 6.7 8.4 9.9 10.5 16.7 17.5 15.3 20.0 Can you conclude that the salinity differs among the areas?arrow_forwardAa Febru The body mass index (BMI) of a person is defined to be the person's body mass divided by the square of the person's height. The article "Influences of Parameter Uncertainties within the ICRP 66 Respiratory Tract Model: Particle Deposition" (W. Bolch, E. Farfan, et al., Health Physics, 2001:378-394) states that body mass index (in kg/m2) in men aged 25-34 is lognormally distributed with parameters u = 3.215 and o = 0.157. a.Find the mean and standard deviation BMI for men aged 25-34. b.Find the standard deviation of BMI for men aged 25-34. c.Find the median BMI for men aged 25-34. d.What proportion of men aged 25-34 have a BMI less than 20? e.Find the 80th percentile of BMI for men agėd 25 -34. 04... Rext 田arrow_forward
 MATLAB: An Introduction with ApplicationsStatisticsISBN:9781119256830Author:Amos GilatPublisher:John Wiley & Sons Inc
 Probability and Statistics for Engineering and th...StatisticsISBN:9781305251809Author:Jay L. DevorePublisher:Cengage Learning
 Statistics for The Behavioral Sciences (MindTap C...StatisticsISBN:9781305504912Author:Frederick J Gravetter, Larry B. WallnauPublisher:Cengage Learning
 Elementary Statistics: Picturing the World (7th E...StatisticsISBN:9780134683416Author:Ron Larson, Betsy FarberPublisher:PEARSON
 The Basic Practice of StatisticsStatisticsISBN:9781319042578Author:David S. Moore, William I. Notz, Michael A. FlignerPublisher:W. H. Freeman
 Introduction to the Practice of StatisticsStatisticsISBN:9781319013387Author:David S. Moore, George P. McCabe, Bruce A. CraigPublisher:W. H. Freeman