
Statistics for Engineers and Scientists
4th Edition
ISBN: 9780073401331
Author: William Navidi Prof.
Publisher: McGraw-Hill Education
expand_more
expand_more
format_list_bulleted
Videos
Textbook Question
Chapter 8, Problem 15SE
The article “Measurements of the Thermal Conductivity and Thermal Diffusivity of Polymer Melts with the Short-Hot-Wire Method” (X. Zhang, W. Hendro, et al., International Journal of Thermophysics, 2002:1077–1090) reports measurements of the thermal conductivity (in W · m–1 · K–1) and diffusivity of several polymers at several temperatures (in 1000 C). The following table presents results for the thermal conductivity of polycarbonate.
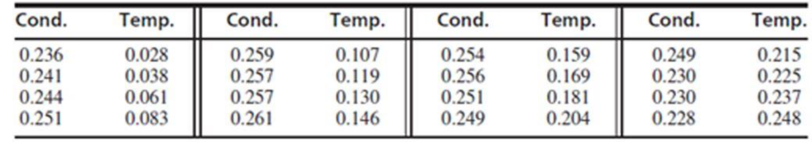
- a. Denoting conductivity by y and temperature by x. fit the linear model
- b. Fit the quadratic model
- c. Fit the cubic model
- d. Fit the quartic model
- e. Which of the models in parts (a) through (d) is the most appropriate? Explain.
- f. Using the most appropriate model, estimate the conductivity at a temperature of 120°C.
Expert Solution & Answer
Want to see the full answer?
Check out a sample textbook solution
Students have asked these similar questions
The article "Mathematical Modeling of the Argon-Oxygen Decarburization Refining
Process of Stainless Steel: Part II. Application of the Model to Industrial Practice" (J. Wei
and D. Zhu, Metallurgical and Materials Transactions B, 2001:212-217) presents the
carbon content (in mass %) and bath temperature (in K) for 32 heats of austenitic stainless
steel. These data are shown in the following table.
Carbon %
Temp.
1975
19
23
1947
22
1954
16
1992
17
1965
18
1971
12
2046
24
1945
17
1984
20
1991
The article "Simulation of the Hot Carbonate Process for Removal of CO, and H,S from
Medium Btu Gas" (K. Park and T. Edgar, Energy Progress, 1984:174–180) presents an
equation used to estimate the equilibrium vapor pressure of CO, in a potassium carbonate
solution. The actual equilibrium pressure (in kPa) was measured in nine different reactions
and compared with the value estimated from the equation. The results are presented in the
following table:
Reaction
Estimated Experimental
Difference
45.10
42.95
2.15
2
85.77
79.98
5.79
3
151.84
146.17
5.67
4.
244.30
228.22
16.08
5
257.67
240.63
17.04
6
44.32
41.99
2.33
84.41
82.05
2.36
8
150.47
149.62
0.85
253.81
245.45
8.36
Find a 95% confidence interval for the mean difference between the estimated and actual
pressures.
The article "Enthalpies and Entropies of Transfer of Electrolytes and Ions from Water to
Mixed Aqueous Organic Solvents" (G. Hefter, Y. Marcus, and W. Waghorne, Chemical
Reviews, 2002:2773–2836) presents measurements of entropy and enthalpy changes for
many salts under a variety of conditions. The following table presents the results for
entropies of transfer (in J/K · mol) from water to water + methanol of NaCl (table salt) over
a range of concentrations of methanol:
Concentration (%)
Entropy
5
10
-1
20
-7
30
-17
40
-28
50
-39
60
-52
70
-65
80
-80
90
-98
100
-121
Fit polynomial models of degrees 1, 2, and 3 to predict the entropy (y) from the
concentration (x).
a.
b.
Which degree polynomial is the most appropriate? Explain.
Using the most appropriate model, find 99% confidence intervals for the coefficients.
C.
Chapter 8 Solutions
Statistics for Engineers and Scientists
Ch. 8.1 - In an experiment to determine the factors...Ch. 8.1 - Prob. 2ECh. 8.1 - Prob. 3ECh. 8.1 - The article Application of Analysis of Variance to...Ch. 8.1 - Prob. 5ECh. 8.1 - Prob. 6ECh. 8.1 - Prob. 7ECh. 8.1 - Refer to Exercise 7. a. Find a 95% confidence...Ch. 8.1 - In a study of the lung function of children, the...Ch. 8.1 - Prob. 10E
Ch. 8.1 - Prob. 11ECh. 8.1 - The following MINITAB output is for a multiple...Ch. 8.1 - Prob. 13ECh. 8.1 - Prob. 14ECh. 8.1 - Prob. 15ECh. 8.1 - The following data were collected in an experiment...Ch. 8.1 - The November 24, 2001, issue of The Economist...Ch. 8.1 - The article Multiple Linear Regression for Lake...Ch. 8.1 - Prob. 19ECh. 8.2 - In an experiment to determine factors related to...Ch. 8.2 - In a laboratory test of a new engine design, the...Ch. 8.2 - In a laboratory test of a new engine design, the...Ch. 8.2 - The article Influence of Freezing Temperature on...Ch. 8.2 - The article Influence of Freezing Temperature on...Ch. 8.2 - The article Influence of Freezing Temperature on...Ch. 8.3 - True or false: a. For any set of data, there is...Ch. 8.3 - The article Experimental Design Approach for the...Ch. 8.3 - Prob. 3ECh. 8.3 - An engineer measures a dependent variable y and...Ch. 8.3 - Prob. 5ECh. 8.3 - The following MINITAB output is for a best subsets...Ch. 8.3 - Prob. 7ECh. 8.3 - Prob. 8ECh. 8.3 - (Continues Exercise 7 in Section 8.1.) To try to...Ch. 8.3 - Prob. 10ECh. 8.3 - Prob. 11ECh. 8.3 - Prob. 12ECh. 8.3 - The article Ultimate Load Analysis of Plate...Ch. 8.3 - Prob. 14ECh. 8.3 - Prob. 15ECh. 8.3 - Prob. 16ECh. 8.3 - The article Modeling Resilient Modulus and...Ch. 8.3 - The article Models for Assessing Hoisting Times of...Ch. 8 - The article Advances in Oxygen Equivalence...Ch. 8 - Prob. 2SECh. 8 - Prob. 3SECh. 8 - Prob. 4SECh. 8 - In a simulation of 30 mobile computer networks,...Ch. 8 - The data in Table SE6 (page 649) consist of yield...Ch. 8 - Prob. 7SECh. 8 - Prob. 8SECh. 8 - Refer to Exercise 2 in Section 8.2. a. Using each...Ch. 8 - Prob. 10SECh. 8 - The data presented in the following table give the...Ch. 8 - The article Enthalpies and Entropies of Transfer...Ch. 8 - Prob. 13SECh. 8 - Prob. 14SECh. 8 - The article Measurements of the Thermal...Ch. 8 - The article Electrical Impedance Variation with...Ch. 8 - The article Groundwater Electromagnetic Imaging in...Ch. 8 - Prob. 18SECh. 8 - Prob. 19SECh. 8 - Prob. 20SECh. 8 - Prob. 21SECh. 8 - Prob. 22SECh. 8 - The article Estimating Resource Requirements at...Ch. 8 - Prob. 24SE
Additional Math Textbook Solutions
Find more solutions based on key concepts
Ten equally qualified marketing assistants are candidates for promotion to associate buyer; seven are men and t...
An Introduction to Mathematical Statistics and Its Applications (6th Edition)
The manufacturer of a nationally distributed brand of potato chips wants to determine the feasibility of changi...
Basic Business Statistics, Student Value Edition (13th Edition)
Teacher Salaries
The following data from several years ago represent salaries (in dollars) from a school distri...
Elementary Statistics: A Step By Step Approach
Use the model developed in Example 1.5 to predict the total sales for weeks 2 through 16, and compare the resul...
Business Analytics
31. Putting It Together: A Tornado Model Is the width of a tornado related to the amount of distance for which ...
Statistics: Informed Decisions Using Data (5th Edition)
Knowledge Booster


Learn more about
Need a deep-dive on the concept behind this application? Look no further. Learn more about this topic, statistics and related others by exploring similar questions and additional content below.Similar questions
- The article "Two Different Approaches for RDC Modelling When Simulating a Solvent Deasphalting Plant" (J. Aparicio, M. Heronimo, et al., Computers and Chemical Engineering, 2002:1369–1377) reports flow rate (in dmh) and specific gravity measurements for a sample of paraffinic hydrocarbons. The natural logs of the flow rates (y) and the specific gravity measurements (x) are presented in the following table. х -1.204 0.8139 -0.580 0.8171 0.049 0.8202 0 673 0.8233 1.311 0.8264 1.959 0.8294 2.614 0.8323 3.270 0.8352 Fit the linear model y = Bo + B,x + ɛ. For each coefficient, test the hypothesis that the coefficient is equal to 0. Fit the quadratic model y = Bo + B,x + B2x? + E. For each coefficient, test the a. b. hypothesis that the coefficient is equal to 0. Fit the cubic model y = Bo + Bix + B2x² + Bax + E. For each coefficient, test the C. hypothesis that the coefficient is equal to 0. Which of the models in parts (a) through (c) is the most appropriate? Explain. Using the most…arrow_forwardThe article "Enthalpies and Entropies of Transfer of Electrolytes and Ions from Water to Mixed Aqueous Organic Solvents" (G. Hefter, Y. Marcus, and W. Waghome, Chemical Reviews, 2002-2773-2836) presents measurements of entropy and enthalpy changes for many salts under a variety of conditions. The following table presents the results for enthalpy of transfer (in kJ/mol) from water to water + methanol of NaCi (table salt) for several concentrations of methanol. Four independent measurements were made at each concentration. Concentration (%) Enthalpy 1.62 1.60 1.62 1.66 10 3.56 3.35 2.69 2.66 2.72 2.73 20 3.45 3.65 3.52 30 3.18 3.40 3.06 a Is it plausible that the enthalpy is the same at all concentrations? Explain. b. Which pairs of concentrations, if any, can you conclude to have differing enthalpies?arrow_forwardThe article "Experimental Measurement of Radiative Heat Transfer in Gas-Solid Suspension Flow System" (G. Han, K. Tuzla, and J. Chen, AIChe Journal, 2002:1910- 1916) discusses the calibration of a radiometer. Several measurements were made on the electromotive force readings of the radiometer (in volts) and the radiation flux (in kilowatts per square meter). The results (read from a graph) are presented in the following table. Heat flux (y) 15 31 51 55 67 89 Signal output (x) 1.08 2.42 4.17 4.46 5.17 6.92 Compute the least-squares line for predicting heat flux from the signal output. If the radiometer reads 3.00 V, predict the heat flux. If the radiometer reads 8.00 V, should the heat flux be predicted? If so, predict it. If not, explain why. C.arrow_forward
- 17.7 Butterfly wings. Researchers studied the morphological attributes of monarch butterflies (Danaus plexippus), a species that undertakes large seasonal migrations over North America. They measured the forewing weight (in milligrams, mg) of a sample of 92 monarch butterflies, all of which had been reared in captivity in identical conditions.° Figure 17.4 shows the output from the statistical software JMP. (The data are also available in the Large.Butterfly the data file if you wish to practice working with your own software.) Estimate with 95% confidence the mean forewing weight of monarch butterflies reared in captivity. Follow the four- step process as illustrated in Example 17.2. 4 STEP そMP FWweight 30 25 20 15 10 11 12 13 14 15 8 9 10 Summary Statistics Mean 11.795652 Std Dev 1.1759413 Std Err Mean 0.1226004 Upper 95% Mean Lower 95% Mean 1 FIGURE 17.4 Software output (JMP) for the forewing weight of monarch 12.039183 11.552122 92 N. butterflies. Countarrow_forwardThe article "Oxidation State and Activities of Chromium Oxides in Cao-SiO,-CrO, Slag System" (Y. Xiao, L. Holappa, and M. Reuter, Metallurgical and Materials Transactions B, 2002:595-603) presents the amount x (in mole percent) and activity coefficient y of CrO,5 for several specimens. The data, extracted from a larger table, are presented in the following table. х У 2.6 10.20 5.03 19.9 8.84 0.8 6.62 5.3 2.89 20.3 2.31 39.4 7.13 5.8 3.40 29.4 5.57 2.2 7.23 5.5 2.12 33.1 1.67 44.2 5.33 13.1 16.70 0.6 9.75 2.2 2.74 16.9 2.58 35.5 1.50 48.0 Compute the least-squares line for predicting y from x. b. Plot the residuals versus the fitted values. Compute the least-squares line for predicting y from 1/x. d. Plot the residuals versus the fitted values. C. Using the better fitting line, find a 95% confidence interval for the mean value of y when x= 5.0.arrow_forwardAir pollutants common in U.S. cities include fine particulate matter (PM) and ozone (O3). PM is measured as “inhalable” particles 10 micrometers in diameter or “fine inhalable” particles 2.5 micrometers in diameter. Suppose that studies show, for a particular region, that cities exceed PM2.5 standards 20% of the time and exceed ozone standards 10% of the time. Assume that PM2.5 and ozone measurements are statistically independent. A) Determine the probability that a city, selected at random, exceeds one of the standards. B) If a city exceeds the standards, what is the probability that it exceeds only the PM2.5 standard?arrow_forward
- In an experiment to determine factors related to weld toughness, the Charpy V-notch impact toughness in ft - 1b (v) was measured for 22 welds at 0°Č, along with the lateral expansion at the notch in % (x,), and the brittle fracture surface in % (x2). The data are presented in the following table. X1 X2 y 32 20.0 28 39 23.0 28 20 12.8 32 21 16.0 29 25 10.2 31 20 11.6 28 32 17.6 25 29 17.8 28 27 16.0 29 43 26.2 27 22 9.6 32 22 15.2 32 18 8.8 43 32 20.4 24 22 12.2 36 25 14.6 36 25 10.4 29 20 11.6 30 20 12.6 31 24 16.2 36 18 9.2 34 28 16.8 30 a. Fit the model y = Bo + B1 X1 + ɛ. For each coefficient, test the null hypothesis that it is equal to 0. b. Fit the model y = Bo + B, xz + ɛ. For each coefficient, test the null hypothesis that it is equal to 0. c. Fit the model y = Bo + B1 X1 + Bzx2 + ɛ. For each coefficient, test the null hypothesis that it is equal to 0. d. Which of the models in parts (a) through (c) is the best of the three? Why do you think %3D + E. so?arrow_forwardQuestion 1 iid Consider two samples 1, 2, fa with E(X) = µ and finite V(X) iid 91, 92,, yn fy with E(Y) = y and finite V (Y) = 2. Assuming that the two samples are independent, show that -y is consistent estimator for Hr - Hy. ... = o2, andarrow_forwardThe article "Experimental Design Approach for the Optimization of the Separation of Enantiomers in Preparative Liquid Chromatography" (S. Lai and Z. Lin, Separation Science and Technology, 2002: 847–875) describes an experiment involving a chemical process designed to separate enantiomers. A model was fit to estimate the cycle time (y) in terms of the flow rate (x1), sample concentration (x2), and mobile-phase composition (x3). The results of a least-squares fit are presented in the following table. (The article did not provide the value of the t statistic for the constant term.) Predictor Coefficient т Constant 1.603 X1 -0.619 -22.289 0.000 X2 0.086 3.084 0.018 0.306 11.011 0.000 0.272 8.542 0.000 0.057 1.802 0.115 0.105 3.300 0.013 X1X2 -0.022 -0.630 0.549 XXз -0.036 -1.004 0.349 X>Xз 0.036 1.018 0.343 Of the following, which is the best next step in the analysis? i. Nothing needs to be done. This model is fine. Drop x;, x;, and x from the model, and then perform an F test. iii. Drop…arrow_forward
- In the article “Measurements of the Thermal Conductivity and Thermal Diffusivity of Polymer Melts with the Short-Hot-Wire Method" (X. Zhang, W. Hendro, et al., International Journal of Thermophysics, 2002:1077–1090), the thermal diffusivity of a liquid measured by the transient short-hot-wire method is given by VIA nla where A is the thermal diffusivity; V and I are the voltage and current applied to the hot wire, respectively; 1 is the length of the wire; and A and a are quantities involving temperature whose values are estimated separately. In this article, the relative uncertainties of these quantities are given as follows: V, 0.01%; I, 0.01%; 1, 1%; A, 0.1%; a,1%. a. Find the relative uncertainty in 2. b. Which would reduce the relative uncertainty more: reducing the relative uncertainty in I to 0.5% or reducing the relative uncertainties in V, I, and A each to 0?arrow_forwardAn article in the Journal of Applied Polymer Science (Vol. 56, pp. 471–476, 1995) studied the effect of the mole ratio of sebacic acid on the intrinsic viscosity of copolyesters.- The data follows: Viscosity 0.45 0.2 0.34 0.58 0.7 0.57 0.55 0.44 Mole ratio 1 0.9 0.8 0.7 0.6 0.5 0.4 0.3 (a) Construct a scatter diagram of the data.arrow_forwardThe article “n-Nonane Hydroconversion on Ni and Pt Containing HMFI, HMOR and HBEA” (G. Kinger and H. Vinek, Applied Catalysis A: General, 2002:139–149) presents hydroconversion rates (in μmol/g · s) of n-nonane over both HMFI and HBEA catalysts. The results are as follows: HMFI: 0.43 0.93 1.91 2.56 3.72 6.19 11.00 HBEA: 0.73 1.12 1.24 2.93 Can you conclude that the mean rate differs between the two catalysts?arrow_forward
arrow_back_ios
SEE MORE QUESTIONS
arrow_forward_ios
Recommended textbooks for you
 MATLAB: An Introduction with ApplicationsStatisticsISBN:9781119256830Author:Amos GilatPublisher:John Wiley & Sons Inc
 Probability and Statistics for Engineering and th...StatisticsISBN:9781305251809Author:Jay L. DevorePublisher:Cengage Learning
 Statistics for The Behavioral Sciences (MindTap C...StatisticsISBN:9781305504912Author:Frederick J Gravetter, Larry B. WallnauPublisher:Cengage Learning
 Elementary Statistics: Picturing the World (7th E...StatisticsISBN:9780134683416Author:Ron Larson, Betsy FarberPublisher:PEARSON
 The Basic Practice of StatisticsStatisticsISBN:9781319042578Author:David S. Moore, William I. Notz, Michael A. FlignerPublisher:W. H. Freeman
 Introduction to the Practice of StatisticsStatisticsISBN:9781319013387Author:David S. Moore, George P. McCabe, Bruce A. CraigPublisher:W. H. Freeman
MATLAB: An Introduction with Applications
Statistics
ISBN:9781119256830
Author:Amos Gilat
Publisher:John Wiley & Sons Inc
Probability and Statistics for Engineering and th...
Statistics
ISBN:9781305251809
Author:Jay L. Devore
Publisher:Cengage Learning
Statistics for The Behavioral Sciences (MindTap C...
Statistics
ISBN:9781305504912
Author:Frederick J Gravetter, Larry B. Wallnau
Publisher:Cengage Learning
Elementary Statistics: Picturing the World (7th E...
Statistics
ISBN:9780134683416
Author:Ron Larson, Betsy Farber
Publisher:PEARSON
The Basic Practice of Statistics
Statistics
ISBN:9781319042578
Author:David S. Moore, William I. Notz, Michael A. Fligner
Publisher:W. H. Freeman
Introduction to the Practice of Statistics
Statistics
ISBN:9781319013387
Author:David S. Moore, George P. McCabe, Bruce A. Craig
Publisher:W. H. Freeman
Hypothesis Testing using Confidence Interval Approach; Author: BUM2413 Applied Statistics UMP;https://www.youtube.com/watch?v=Hq1l3e9pLyY;License: Standard YouTube License, CC-BY
Hypothesis Testing - Difference of Two Means - Student's -Distribution & Normal Distribution; Author: The Organic Chemistry Tutor;https://www.youtube.com/watch?v=UcZwyzwWU7o;License: Standard Youtube License