
Statistics for Engineers and Scientists
4th Edition
ISBN: 9780073401331
Author: William Navidi Prof.
Publisher: McGraw-Hill Education
expand_more
expand_more
format_list_bulleted
Concept explainers
Videos
Textbook Question
Chapter 8, Problem 6SE
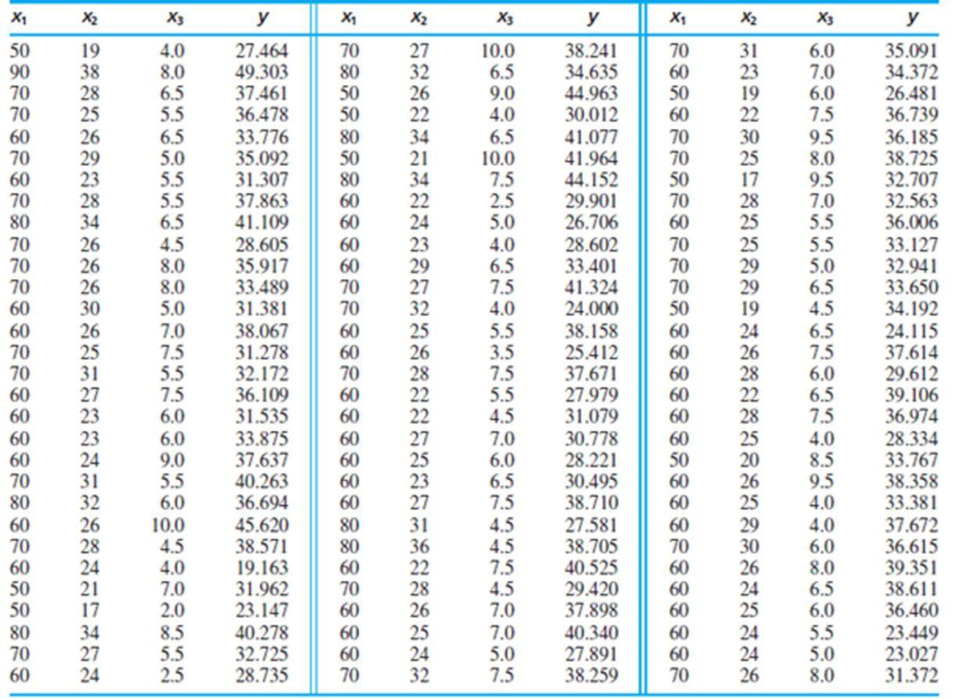
The data in Table SE6 (page 649) consist of yield measurements from many runs of a chemical reaction. The quantities varied were the temperature in °C (x1), the concentration of the primary reactant in % (x2), and the duration of the reaction in hours (x3). The dependent variable (y) is the fraction converted to the desired product.
- a. Fit the linear model
- b. Two of the variables in this model have coefficients significantly different from 0 at the 15% level. Fit a linear regression model containing these two variables.
- c. Compute the product (interaction) of the two variables referred to in part (b). Fit the model that contains the two variables along with the interaction term.
- d. Based on the results in parts (a) through (c), specify a model that appears to be good for predicting y from x1 x2, and x3.
- e. Might it be possible to construct an equally good or better model in another way?
TABLE SE6 Data for Exercise 6
Expert Solution & Answer
Want to see the full answer?
Check out a sample textbook solution
Students have asked these similar questions
Solids (grams) obtained from a material as y, with respect to drying time (Hours) as x. Ten experiments were carried out to obtain the following observations:
Table on the picture
(a) Create a scatter diagram for the data.
(b) Estimated regression model according to the data conditions.
(c) Calculate Model Accuracy (R²) and Relationship Between Variables (r²)
The return rates of crane (Tagak) in Bulacan was studied using regression analysis and this relationship between return rate (x: % of birds that return to the colony in a given year) and immigration rate (y: % of new adults that join the colony per year) was established. The following regression equation was obtained: y = 31.9 – 0.34x. Based on this estimated regression equation, if the return rate were to decrease by 10% the rate of immigration to the colony would:
A. decrease by 0.34%
B. increase by 34%
C. increase by 3.4%
D. decrease by 3.4%
The following is an estimated supply regression for sugar:
Y = 0:025 + 1:5X
where Y is supply in kilos and X is price
) per kilo.
(i) Interpret the coefficient of variable X.
(ii) Predict the supply when price is
(iii) Given that r(x, y) = 1 in the above case, interpret the implied relationship between price and
quantity supplied.
20 per kilo.
Chapter 8 Solutions
Statistics for Engineers and Scientists
Ch. 8.1 - In an experiment to determine the factors...Ch. 8.1 - Prob. 2ECh. 8.1 - Prob. 3ECh. 8.1 - The article Application of Analysis of Variance to...Ch. 8.1 - Prob. 5ECh. 8.1 - Prob. 6ECh. 8.1 - Prob. 7ECh. 8.1 - Refer to Exercise 7. a. Find a 95% confidence...Ch. 8.1 - In a study of the lung function of children, the...Ch. 8.1 - Prob. 10E
Ch. 8.1 - Prob. 11ECh. 8.1 - The following MINITAB output is for a multiple...Ch. 8.1 - Prob. 13ECh. 8.1 - Prob. 14ECh. 8.1 - Prob. 15ECh. 8.1 - The following data were collected in an experiment...Ch. 8.1 - The November 24, 2001, issue of The Economist...Ch. 8.1 - The article Multiple Linear Regression for Lake...Ch. 8.1 - Prob. 19ECh. 8.2 - In an experiment to determine factors related to...Ch. 8.2 - In a laboratory test of a new engine design, the...Ch. 8.2 - In a laboratory test of a new engine design, the...Ch. 8.2 - The article Influence of Freezing Temperature on...Ch. 8.2 - The article Influence of Freezing Temperature on...Ch. 8.2 - The article Influence of Freezing Temperature on...Ch. 8.3 - True or false: a. For any set of data, there is...Ch. 8.3 - The article Experimental Design Approach for the...Ch. 8.3 - Prob. 3ECh. 8.3 - An engineer measures a dependent variable y and...Ch. 8.3 - Prob. 5ECh. 8.3 - The following MINITAB output is for a best subsets...Ch. 8.3 - Prob. 7ECh. 8.3 - Prob. 8ECh. 8.3 - (Continues Exercise 7 in Section 8.1.) To try to...Ch. 8.3 - Prob. 10ECh. 8.3 - Prob. 11ECh. 8.3 - Prob. 12ECh. 8.3 - The article Ultimate Load Analysis of Plate...Ch. 8.3 - Prob. 14ECh. 8.3 - Prob. 15ECh. 8.3 - Prob. 16ECh. 8.3 - The article Modeling Resilient Modulus and...Ch. 8.3 - The article Models for Assessing Hoisting Times of...Ch. 8 - The article Advances in Oxygen Equivalence...Ch. 8 - Prob. 2SECh. 8 - Prob. 3SECh. 8 - Prob. 4SECh. 8 - In a simulation of 30 mobile computer networks,...Ch. 8 - The data in Table SE6 (page 649) consist of yield...Ch. 8 - Prob. 7SECh. 8 - Prob. 8SECh. 8 - Refer to Exercise 2 in Section 8.2. a. Using each...Ch. 8 - Prob. 10SECh. 8 - The data presented in the following table give the...Ch. 8 - The article Enthalpies and Entropies of Transfer...Ch. 8 - Prob. 13SECh. 8 - Prob. 14SECh. 8 - The article Measurements of the Thermal...Ch. 8 - The article Electrical Impedance Variation with...Ch. 8 - The article Groundwater Electromagnetic Imaging in...Ch. 8 - Prob. 18SECh. 8 - Prob. 19SECh. 8 - Prob. 20SECh. 8 - Prob. 21SECh. 8 - Prob. 22SECh. 8 - The article Estimating Resource Requirements at...Ch. 8 - Prob. 24SE
Additional Math Textbook Solutions
Find more solutions based on key concepts
Alvie Singer lives at 0 in the accompanying diagram and has four friends who live at A, B, C, and D. One day Al...
Probability and Statistics for Engineering and the Sciences
Individuals in Jake’s study.
The Practice of Statistics for AP - 4th Edition
Medication Usage In a survey of 3005 adults aged 57 through 85 years, it was found that 82% of them used at lea...
Statistical Reasoning for Everyday Life (5th Edition)
the type of variable is the response.
Stats: Modeling the World Nasta Edition Grades 9-12
AVX Home Entertainment, Inc., recently began a “no-hassles” return policy. A sample of 500 customers who recent...
EBK STATISTICAL TECHNIQUES IN BUSINESS
UW Student survey In a University of Wisconsin (UW) study about alcohol abuse among students, 100 of the 40,858...
Statistics: The Art and Science of Learning from Data (4th Edition)
Knowledge Booster


Learn more about
Need a deep-dive on the concept behind this application? Look no further. Learn more about this topic, statistics and related others by exploring similar questions and additional content below.Similar questions
- bThe average rate of change of the linear function f(x)=3x+5 between any two points is ________.arrow_forwardFind the equation of the regression line for the following data set. x 1 2 3 y 0 3 4arrow_forwardThe return rates of crane (Tagak) in Bulacan was studied using regression analysis and this relationship between return rate (x: % of birds that return to the colony in a givenyear) and immigration rate (y: % of new adults that join the colony per year) was established. The following regression equation was obtained: y = 31.9 – 0.34x. Based on this estimated regression equation, if the return rate were to decrease by 10% the rate of immigration to the colony would:arrow_forward
- The return rates of crane (Tagak) in Bulacan was studied using regression analysis and this relationship between return rate (x: % of birds that return to the colony in a givenyear) and immigration rate (y: % of new adults that join the colony per year) was established. The following regression equation was obtained: y = 31.9 – 0.34x. Based on this estimated regression equation, if the return rate were to decrease by 10% the rate of immigration to the colony would: A. increase by 3.4% B. decrease by 3.4% C. increase by 34% D. decrease by 0.34%arrow_forwardIn a comprehensive road test on new car models, one variable measured is the time it takes a car to accelerate from 0 to 60 miles per hour. To model acceleration time, a regression analysis is conducted on a random sample of 129 new cars. TIME60: y = Elapsed time (in seconds) from 0 mph to 60 mph MAX: x = Maximum speed attained (miles per hour) The simple linear model E(y) = Bo + B1x was fit to the data. Computer printouts for the analysis are given below: NWEIGHTED LEAST SQUARES LINEAR REGRESSION OF TIME60 PREDICTOR VARIABLES COEFFICIENT STD ERROR STUDENT'S T CONSTANT 187171 0.63708 29.38 0.0000 0.0000 MAX -0.08365 0.00491 -17.05 0.6960 0.6937 R-SQUARED RESID. MEAN SQUARE (MSE) 1.28695 ADJUSTED R-SQUARED STAND ARD DEVIATION 113444 SOURCE DF MS F REGRESSION 374.285 0.0000 374.285 1.28695 290.83 RESIDUAL 127 163.443 TOTAL 128 537.728 CASES INCLUDED 129 MISSING CASES 0 Fill in the blank: "At a =.05, there is between maximum speed and acceleration time." O sufficient evidence of a…arrow_forwardA study monitored the life spans of 129 robins over a 4-year period. The equation y=2−log(100−x)0.42y=2−log(100−x)0.42y=2−log(100−x)0.42y=2−log(100−x)0.42was developed to calculate the number of years y it takes for x percent of the robin population to die. (Source: Lack, D., The life of a Robin, Collins). What percentage of the Robins had died after 6 months?arrow_forward
- In a linear regression model, E (y) = a + Bx, ß represents: x-intercept the change in E(y) for a one-unit increase in x variable O the change in x variable for a one-unit increase in y variable. Oy-intercept Ocorrelationarrow_forwardA chemistry experiment is performed measuring the solubility of potassium chloride (KCl) in water at different temperatures. The goal was to determine if there is a linear relationship between the temperature of the water and how much KCl can dissolve, measured as grams per 100 milliliter (g/100mL). After the experiments were performed, the following data was collected with temperature being the independent x-variable and solubility being the dependent y-variable: Temperature (°C) x Solubility (g/100mL) y 10 31 20 33 30 37 40 41 50 42 Based on the data given for temperature and solubility of KCl and without doing any math yet, which of the following do you predict would best describe the relationship between these variables? A positive linear relationship (r close to 1) A positive linear relationship (r close to -1) A negative linear relationship (r close to 1) A negative linear relationship (r close to -1)…arrow_forwardB, + I, + U, where C; indicates the household's consumption level, and lj indicates the household's income level. The measurement Consider the regression function C, error in the dependent variable Cjimplies that %3D A. the error term might be heteroskedastic. B. the independent variable lj is also subject to measurement errors. C. the independent variable /j will be endogenous. D. there will be simultaneous equations between Cjand Ij.arrow_forward
- Use the given data to find a regression line that best fits the total annual cost data for cost C in dollars as a function of the production level x widgets. Here, cost is the dependent variable, and production level is the independent variable. Find the regression function for cost, and write it as C ( x ) = m x + b, where m is rounded to the nearest tenth, and b is rounded to the nearest tenth. Enter the value for m, rounded to the nearest tenth. Enter the value for b, rounded to the nearest tenth. Use the regression function C ( x ) = m x + b with m rounded to the nearest tenth and b rounded to the nearest tenth. Compute C ( 45 ), rounded to the nearest tenth. Use the regression function C ( x ) = m x + b with m rounded to the nearest tenth and b rounded to the nearest tenth. Compute C ( 0 ), rounded to the nearest tenth.arrow_forwardI need help with part c please: Linear regression equation ŷ = 6.6500 + 1.7000x Temperature, x Converted Sugar, y 1 8.2 1.1 8.1 1.2 8.7 1.3 9.9 1.4 9.6 1.5 8.7 1.6 8.2 1.7 10.6 1.8 9.3 1.9 9.2 2 10.7arrow_forwardb. Use the regression line to estimate y when x=57.arrow_forward
arrow_back_ios
arrow_forward_ios
Recommended textbooks for you
 Algebra & Trigonometry with Analytic GeometryAlgebraISBN:9781133382119Author:SwokowskiPublisher:Cengage
 Functions and Change: A Modeling Approach to Coll...AlgebraISBN:9781337111348Author:Bruce Crauder, Benny Evans, Alan NoellPublisher:Cengage Learning
 College Algebra (MindTap Course List)AlgebraISBN:9781305652231Author:R. David Gustafson, Jeff HughesPublisher:Cengage Learning
 Algebra and Trigonometry (MindTap Course List)AlgebraISBN:9781305071742Author:James Stewart, Lothar Redlin, Saleem WatsonPublisher:Cengage Learning
Algebra & Trigonometry with Analytic Geometry
Algebra
ISBN:9781133382119
Author:Swokowski
Publisher:Cengage
Functions and Change: A Modeling Approach to Coll...
Algebra
ISBN:9781337111348
Author:Bruce Crauder, Benny Evans, Alan Noell
Publisher:Cengage Learning
College Algebra (MindTap Course List)
Algebra
ISBN:9781305652231
Author:R. David Gustafson, Jeff Hughes
Publisher:Cengage Learning
Algebra and Trigonometry (MindTap Course List)
Algebra
ISBN:9781305071742
Author:James Stewart, Lothar Redlin, Saleem Watson
Publisher:Cengage Learning
Correlation Vs Regression: Difference Between them with definition & Comparison Chart; Author: Key Differences;https://www.youtube.com/watch?v=Ou2QGSJVd0U;License: Standard YouTube License, CC-BY
Correlation and Regression: Concepts with Illustrative examples; Author: LEARN & APPLY : Lean and Six Sigma;https://www.youtube.com/watch?v=xTpHD5WLuoA;License: Standard YouTube License, CC-BY