
Statistics for Engineers and Scientists
4th Edition
ISBN: 9780073401331
Author: William Navidi Prof.
Publisher: McGraw-Hill Education
expand_more
expand_more
format_list_bulleted
Concept explainers
Videos
Textbook Question
Chapter 8.1, Problem 18E
The article “Multiple Linear Regression for Lake lee and Lake Temperature Characteristics” (S. Gao and H. Stefan, Journal of Cold Regions Engineering, 1999:59–77) presents data on maximum ice thickness in mm (y), average number of days per year of ice cover (x1), average number of days the bottom temperature is lower than 8°C (x2), and the average snow depth in mm (x3) for 13 lakes in Minnesota. The data are presented in the following table.
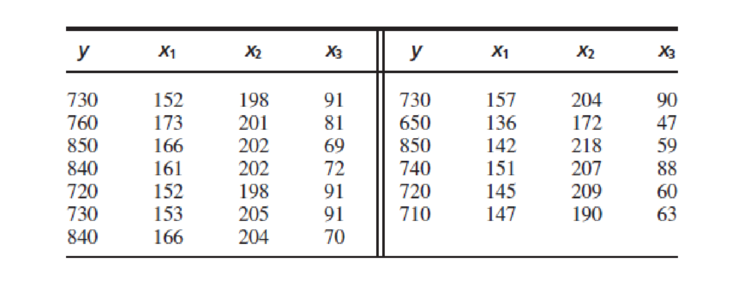
- a. Fit the model y = β0 + β1x1 + β2x2 + β3x3 + ε. For each coefficient, find the P-value for testing the null hypothesis that the coefficient is equal to 0.
- b. If two lakes differ by 2 in the average number of days per year of ice cover, with other variables being equal, by how much would you expect their maximum ice thicknesses to differ?
- c. Do lakes with greater average snow depth tend to have greater or lesser maximum ice thickness? Explain.
Expert Solution & Answer
Want to see the full answer?
Check out a sample textbook solution
Students have asked these similar questions
Assume we have data demonstrating a strong linear link between the amount of fertilizer applied to certain plants and their yield. Which is the independent variable in this research question?
The article "Earthmoving Productivity Estimation Using Linear Regression Techniques" (S.
Smith, Journal of Construction Engineering and Management, 1999:133–141) presents the
following linear model to predict earth-moving productivity (in m3 moved per hour):
Productivity = - 297.877 + 84.787x, + 36.806x, + 151.680x, – 0.081x, – 110.517x5
- 0.267.x, – 0.016x,x, +0.107.x,x5 + 0.0009448x,x, – 0.244x;x,
where
X1 = number of trucks
X2 = number of buckets per load
X3 = bucket volume, in m³
X4 = haul length, in m
X5 = match factor (ratio of hauling capacity to loading capacity)
X6 = truck travel time, in s
If the bucket volume increases by 1 m², while other independent variables are
unchanged, can you determine the change in the predicted productivity? If so,
determine it. If not, state what other information you would need to determine it.
b. If the haul length increases by 1 m, can you determine the change in the predicted
productivity? If so, determine it. If not, state what other…
3. Wine Participant magazine has collected average price per bottle for the prestigious Chateau Le Thundebird bordeaux for different vintages (years).
The data appears in the table below.
year of bottling
price
a) draw the scatter diagram showing how wine price varies by vintage year
b) use the most appropriate regression equation to determine the relationship
between year of bottling (age) and price.
c) what is the explanatory power (RSQ) of that equation
d) determine the predicted price of a bottle of this wine for the 2017 vintage.
2009
36
2010
40
2011
51
2012
60
2013
68
2014
72
2015
70
2016
65
2018
51
2019
44
2020
39
Chapter 8 Solutions
Statistics for Engineers and Scientists
Ch. 8.1 - In an experiment to determine the factors...Ch. 8.1 - Prob. 2ECh. 8.1 - Prob. 3ECh. 8.1 - The article Application of Analysis of Variance to...Ch. 8.1 - Prob. 5ECh. 8.1 - Prob. 6ECh. 8.1 - Prob. 7ECh. 8.1 - Refer to Exercise 7. a. Find a 95% confidence...Ch. 8.1 - In a study of the lung function of children, the...Ch. 8.1 - Prob. 10E
Ch. 8.1 - Prob. 11ECh. 8.1 - The following MINITAB output is for a multiple...Ch. 8.1 - Prob. 13ECh. 8.1 - Prob. 14ECh. 8.1 - Prob. 15ECh. 8.1 - The following data were collected in an experiment...Ch. 8.1 - The November 24, 2001, issue of The Economist...Ch. 8.1 - The article Multiple Linear Regression for Lake...Ch. 8.1 - Prob. 19ECh. 8.2 - In an experiment to determine factors related to...Ch. 8.2 - In a laboratory test of a new engine design, the...Ch. 8.2 - In a laboratory test of a new engine design, the...Ch. 8.2 - The article Influence of Freezing Temperature on...Ch. 8.2 - The article Influence of Freezing Temperature on...Ch. 8.2 - The article Influence of Freezing Temperature on...Ch. 8.3 - True or false: a. For any set of data, there is...Ch. 8.3 - The article Experimental Design Approach for the...Ch. 8.3 - Prob. 3ECh. 8.3 - An engineer measures a dependent variable y and...Ch. 8.3 - Prob. 5ECh. 8.3 - The following MINITAB output is for a best subsets...Ch. 8.3 - Prob. 7ECh. 8.3 - Prob. 8ECh. 8.3 - (Continues Exercise 7 in Section 8.1.) To try to...Ch. 8.3 - Prob. 10ECh. 8.3 - Prob. 11ECh. 8.3 - Prob. 12ECh. 8.3 - The article Ultimate Load Analysis of Plate...Ch. 8.3 - Prob. 14ECh. 8.3 - Prob. 15ECh. 8.3 - Prob. 16ECh. 8.3 - The article Modeling Resilient Modulus and...Ch. 8.3 - The article Models for Assessing Hoisting Times of...Ch. 8 - The article Advances in Oxygen Equivalence...Ch. 8 - Prob. 2SECh. 8 - Prob. 3SECh. 8 - Prob. 4SECh. 8 - In a simulation of 30 mobile computer networks,...Ch. 8 - The data in Table SE6 (page 649) consist of yield...Ch. 8 - Prob. 7SECh. 8 - Prob. 8SECh. 8 - Refer to Exercise 2 in Section 8.2. a. Using each...Ch. 8 - Prob. 10SECh. 8 - The data presented in the following table give the...Ch. 8 - The article Enthalpies and Entropies of Transfer...Ch. 8 - Prob. 13SECh. 8 - Prob. 14SECh. 8 - The article Measurements of the Thermal...Ch. 8 - The article Electrical Impedance Variation with...Ch. 8 - The article Groundwater Electromagnetic Imaging in...Ch. 8 - Prob. 18SECh. 8 - Prob. 19SECh. 8 - Prob. 20SECh. 8 - Prob. 21SECh. 8 - Prob. 22SECh. 8 - The article Estimating Resource Requirements at...Ch. 8 - Prob. 24SE
Knowledge Booster


Learn more about
Need a deep-dive on the concept behind this application? Look no further. Learn more about this topic, statistics and related others by exploring similar questions and additional content below.Similar questions
- 2) Use Data Linearization technique to perform a fit in the form of y = (x^B)-¹ using the given data. x y 0.5 1.333 0.9 0.4115 0.333 1.5 0.231arrow_forwardState the four conditions required for making inferences in multiple linear regression analysisarrow_forwardA linear regression to quantify the salaries of the employees in a company is estimated, using the following variables: Y: the salary of the employee in 1000 SEK. Age: the age of the employee in years R: the categorical variable Education with 3 groups; Primary, Secondary, University. a)Write down a linear model with intercept for the variable Y based on Age and R, in which the Primary level of education is the reference category for the Education variable. b)Mention a test to see if the variable Age significantly improves the model fit?arrow_forward
- Show the best fitted line on scatter diagram and Find the predicted value for each y using the exposure time and the equation obtained in part b (b. Find the equation of regression line between radiation doses on exposure time .usingleast square method)arrow_forwardIdentify two graphs used in a residual analysis to check the Assumptions 1–3 for regression inferences, and explain the reasoning behind their use.arrow_forwardDisk drives last time Here is a scatterplot of the residu-als from the regression of the hard drive prices on their sizes from Exercise 18.a) Are any assumptions or conditions violated? If so,which ones?b) What would you recommend about this regression?arrow_forward
- A researcher interested in explaining the level of foreign reserves for the country of Barbados estimated the following multiple regression model using yearly data spanning the period 2001 to 2016: FR=a+B0IL+YEXP+8FDI Where FR = yearly foreign reserves ($000°s), OIL = annual oil prices, EXP = yearly total exports ($000's) and FDI = annual foreign direct investment ($000`s). The sample of data was processed using MINITAB and the following is an extract of the output obtained: Predictor Coef StDev t-ratio p-value Constant 5491.38 2508.81 2.1888 0.0491 OIL 85.39 18.46 4.626 0.0006 EXP -377.08 112.19 0.0057 FDI -396.99 160.66 -2.471 ** s = 2.45 R-sq = 96.3% R-sq (adj) = 95.3% Analysis of Variance Source DF MS F Regression 1991.31 663.77 ?? Error 12 77.4 6.45 Total 15 c) Fill in the missing values ?'and ??arrow_forwardA researcher interested in explaining the level of foreign reserves for the country of Barbados estimated the following multiple regression model using yearly data spanning the period 2001 to 2016: FR=a+B0IL+YEXP+8FDI Where FR = yearly foreign reserves ($000°s), OIL = annual oil prices, EXP = yearly total exports ($000's) and FDI = annual foreign direct investment ($000`s). The sample of data was processed using MINITAB and the following is an extract of the output obtained: Predictor Coef StDev t-ratio p-value Constant 5491.38 2508.81 2.1888 0.0491 OIL 85.39 18.46 4.626 0.0006 EXP -377.08 112.19 0.0057 FDI -396.99 160.66 -2.471 ** s = 2.45 R-sq = 96.3% R-sq (adj) = 95.3% Analysis of Variance Source DF MS F Regression 1991.31 663.77 ?? Error 12 77.4 6.45 Total 15 d) Hence test whether ß is significant. Give reasons for your answer. e) Perform the F Test making sure to state the null and alternative hypothesis. f) Given an interpretation of the term “R-sq“ and comment on its value.arrow_forwardA researcher interested in explaining the level of foreign reserves for the country of Barbados estimated the following multiple regression model using yearly data spanning the period 2001 to 2016: FR=a+B0IL+YEXP+8FDI Where FR = yearly foreign reserves ($000°s), OIL = annual oil prices, EXP = yearly total exports ($000's) and FDI = annual foreign direct investment ($000`s). The sample of data was processed using MINITAB and the following is an extract of the output obtained: Predictor Coef StDev t-ratio p-value Constant 5491.38 2508.81 2.1888 0.0491 OIL 85.39 18.46 4.626 0.0006 EXP -377.08 112.19 0.0057 FDI -396.99 160.66 -2.471 ** s = 2.45 R-sq = 96.3% R-sq (adj) = 95.3% Analysis of Variance Source DF MS F Regression 1991.31 663.77 ?? Error 12 77.4 6.45 Total 15 a) What is dependent and independent variables? b) Fully write out the regression equationarrow_forward
- Define Dynamic effects and the distributed lag model?arrow_forwardAn experiment is conducted to see the effect of light intensity on plant growth, what is the dependent variable in this scenario?arrow_forwarda) We conduct a regression of size on hhinc, owner, hhsize, hhsize2,and hhsize3. We do not include the constant. The regression output is reported in Table 3. Would you conclude that the home size increases with the household size? Interpret the sign and magnitude of the estimated coefficients of hhsize1, hhsize2, and hhsize3.arrow_forward
arrow_back_ios
SEE MORE QUESTIONS
arrow_forward_ios
Recommended textbooks for you
 Trigonometry (MindTap Course List)TrigonometryISBN:9781305652224Author:Charles P. McKeague, Mark D. TurnerPublisher:Cengage Learning
Trigonometry (MindTap Course List)
Trigonometry
ISBN:9781305652224
Author:Charles P. McKeague, Mark D. Turner
Publisher:Cengage Learning
Correlation Vs Regression: Difference Between them with definition & Comparison Chart; Author: Key Differences;https://www.youtube.com/watch?v=Ou2QGSJVd0U;License: Standard YouTube License, CC-BY
Correlation and Regression: Concepts with Illustrative examples; Author: LEARN & APPLY : Lean and Six Sigma;https://www.youtube.com/watch?v=xTpHD5WLuoA;License: Standard YouTube License, CC-BY