
Statistics for Engineers and Scientists
4th Edition
ISBN: 9780073401331
Author: William Navidi Prof.
Publisher: McGraw-Hill Education
expand_more
expand_more
format_list_bulleted
Concept explainers
Videos
Textbook Question
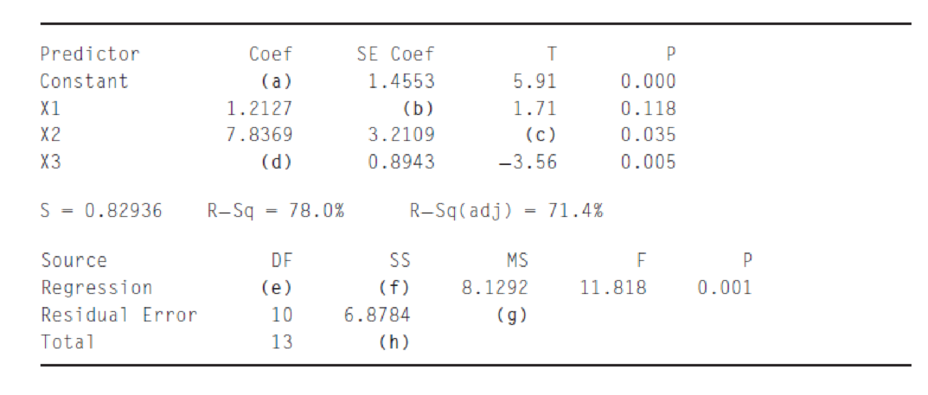
Chapter 8.1, Problem 12E
The following MINITAB output is for a multiple regression. Some of the numbers got smudged and are illegible. Fill in the missing numbers.
Expert Solution & Answer
Want to see the full answer?
Check out a sample textbook solution
Students have asked these similar questions
Find the mean of the regression squares
State the regression equation and use it to predict taxes for a house with lot size 10K.
If we performed a t-test, how many people would be in the study based on the regression model in photo.
Chapter 8 Solutions
Statistics for Engineers and Scientists
Ch. 8.1 - In an experiment to determine the factors...Ch. 8.1 - Prob. 2ECh. 8.1 - Prob. 3ECh. 8.1 - The article Application of Analysis of Variance to...Ch. 8.1 - Prob. 5ECh. 8.1 - Prob. 6ECh. 8.1 - Prob. 7ECh. 8.1 - Refer to Exercise 7. a. Find a 95% confidence...Ch. 8.1 - In a study of the lung function of children, the...Ch. 8.1 - Prob. 10E
Ch. 8.1 - Prob. 11ECh. 8.1 - The following MINITAB output is for a multiple...Ch. 8.1 - Prob. 13ECh. 8.1 - Prob. 14ECh. 8.1 - Prob. 15ECh. 8.1 - The following data were collected in an experiment...Ch. 8.1 - The November 24, 2001, issue of The Economist...Ch. 8.1 - The article Multiple Linear Regression for Lake...Ch. 8.1 - Prob. 19ECh. 8.2 - In an experiment to determine factors related to...Ch. 8.2 - In a laboratory test of a new engine design, the...Ch. 8.2 - In a laboratory test of a new engine design, the...Ch. 8.2 - The article Influence of Freezing Temperature on...Ch. 8.2 - The article Influence of Freezing Temperature on...Ch. 8.2 - The article Influence of Freezing Temperature on...Ch. 8.3 - True or false: a. For any set of data, there is...Ch. 8.3 - The article Experimental Design Approach for the...Ch. 8.3 - Prob. 3ECh. 8.3 - An engineer measures a dependent variable y and...Ch. 8.3 - Prob. 5ECh. 8.3 - The following MINITAB output is for a best subsets...Ch. 8.3 - Prob. 7ECh. 8.3 - Prob. 8ECh. 8.3 - (Continues Exercise 7 in Section 8.1.) To try to...Ch. 8.3 - Prob. 10ECh. 8.3 - Prob. 11ECh. 8.3 - Prob. 12ECh. 8.3 - The article Ultimate Load Analysis of Plate...Ch. 8.3 - Prob. 14ECh. 8.3 - Prob. 15ECh. 8.3 - Prob. 16ECh. 8.3 - The article Modeling Resilient Modulus and...Ch. 8.3 - The article Models for Assessing Hoisting Times of...Ch. 8 - The article Advances in Oxygen Equivalence...Ch. 8 - Prob. 2SECh. 8 - Prob. 3SECh. 8 - Prob. 4SECh. 8 - In a simulation of 30 mobile computer networks,...Ch. 8 - The data in Table SE6 (page 649) consist of yield...Ch. 8 - Prob. 7SECh. 8 - Prob. 8SECh. 8 - Refer to Exercise 2 in Section 8.2. a. Using each...Ch. 8 - Prob. 10SECh. 8 - The data presented in the following table give the...Ch. 8 - The article Enthalpies and Entropies of Transfer...Ch. 8 - Prob. 13SECh. 8 - Prob. 14SECh. 8 - The article Measurements of the Thermal...Ch. 8 - The article Electrical Impedance Variation with...Ch. 8 - The article Groundwater Electromagnetic Imaging in...Ch. 8 - Prob. 18SECh. 8 - Prob. 19SECh. 8 - Prob. 20SECh. 8 - Prob. 21SECh. 8 - Prob. 22SECh. 8 - The article Estimating Resource Requirements at...Ch. 8 - Prob. 24SE
Additional Math Textbook Solutions
Find more solutions based on key concepts
Develop a spreadsheet for computing the demand for any values of the input variables in the linear demand and n...
Business Analytics
Find how many SDs above the mean price would be predicted to cost.
Intro Stats, Books a la Carte Edition (5th Edition)
1. How is a sample related to a population?
Elementary Statistics: Picturing the World (6th Edition)
Testing Hypotheses. In Exercises 13-24, assume that a simple random sample has been selected and test the given...
Elementary Statistics Using The Ti-83/84 Plus Calculator, Books A La Carte Edition (5th Edition)
31. Putting It Together: A Tornado Model Is the width of a tornado related to the amount of distance for which ...
Statistics: Informed Decisions Using Data (5th Edition)
10. Explain the steps in designing an experiment.
Fundamentals of Statistics (5th Edition)
Knowledge Booster


Learn more about
Need a deep-dive on the concept behind this application? Look no further. Learn more about this topic, statistics and related others by exploring similar questions and additional content below.Similar questions
- Find the equation of the regression line for the following data set. x 1 2 3 y 0 3 4arrow_forwardA production manager has compared the dexterity test scores of five assembly line employees with their hourly productivity. Find a relationship between these two variables. Compute for Sxx, Sxy, xbar, ybar, ahat and bhat to find the equation of the regression line. Show your solutionarrow_forwardWrite down the different Multiple Regression Equations?arrow_forward
- A real estate company wanted to see the relationship between home prices and square footage of homes for sale. The regression line is ŷ = –802,456 + 144x, where x is the square footage of a home. Complete the statement based on the information. For every -square-foot increase, the predicted home price is predicted to increase by $arrow_forwardfind the equation of the regression line. Round to 3 decimal places.arrow_forwardThe following table shows the number of fixed-line telephone subscribers in the United Kingdom (?x is years since 2000): Year 3 7 11 Subscribers (millions) 35 31 28 Find the regression line. Do not round till the end, then round to one decimal place as needed. y= x+ =arrow_forward
- Find the equation of the regression linearrow_forwardUse these data and multiple regression to make predictions of the motel chain’s revenues during the next four quarters. Assume that advertising during each of the next four quarters is $50,000arrow_forwardUse Excel Spreadsheets, Google Sheets, or GeoGebra to create a scatter plot for the data below. (You will upload your graph in the next question.) Use the graph to answer the questions below the table. The following data are the morning and evening high tide levels for Charleston, SC from January 1-14,2017. The information for the PM high tide for January 4 is missing. Create a scatter plot. Find the regression line and use it to estimate the PM high tide for January 4. Then find the correlation coefficient. (NOTE: The first column identifies the day. This data will not be used in the scatter plot.) Day AM High (in feet), xx PM High (in feet), yy 1 5.6 4.8 2 5.5 4.8 3 5.4 4.9 4 5.2 5 5.0 5.1 6 5.2 5.0 7 5.4 4.9 8 5.7 5.0 9 6.0 5.1 10 6.3 5.3 11 6.4 5.4 12 6.5 5.4 13 6.4 5.4 14 6.2 5.3 Source: SCDHEC.govarrow_forward
- Find the interpretation of the regression analysisarrow_forwardThe file Galton on D2L contains the 928 observations Francis Galton used in 1885 to estimate the relationship between the heights of parents and the heights of their children. The column Children refers to the height (in inches) of a child, and the column Mid-Parents refers to the average height (in inches) of the mother and father of that child. You can download this file into Excel and Minitab. a. Calculate the regression Height of Children = a +b (Height of Mid-Parents). b. Calculate the average for Height of Children, and calculate the average Height of Mid-Parents. c. Create a new variable in Minitab which is the Height of Children measured in terms of deviations from its mean. Call this new variable y. Also, create a new variable in Minitab with is the Height of Mid-Parents measured in terms of deviations from its mean. Call this new variable x. Calculate the regression y = a + bx. You can create the new y and x variables in Excel of Minitab, whichever you find more convenient.…arrow_forwardWrite a multiple regression equation that can be used to analyze the data for a two-factorialdesign with two levels for factor A and three levels for factor B. Define all variables.arrow_forward
arrow_back_ios
SEE MORE QUESTIONS
arrow_forward_ios
Recommended textbooks for you
 Functions and Change: A Modeling Approach to Coll...AlgebraISBN:9781337111348Author:Bruce Crauder, Benny Evans, Alan NoellPublisher:Cengage Learning
 Glencoe Algebra 1, Student Edition, 9780079039897...AlgebraISBN:9780079039897Author:CarterPublisher:McGraw Hill
 Algebra: Structure And Method, Book 1AlgebraISBN:9780395977224Author:Richard G. Brown, Mary P. Dolciani, Robert H. Sorgenfrey, William L. ColePublisher:McDougal Littell
Functions and Change: A Modeling Approach to Coll...
Algebra
ISBN:9781337111348
Author:Bruce Crauder, Benny Evans, Alan Noell
Publisher:Cengage Learning
Glencoe Algebra 1, Student Edition, 9780079039897...
Algebra
ISBN:9780079039897
Author:Carter
Publisher:McGraw Hill
Algebra: Structure And Method, Book 1
Algebra
ISBN:9780395977224
Author:Richard G. Brown, Mary P. Dolciani, Robert H. Sorgenfrey, William L. Cole
Publisher:McDougal Littell
Correlation Vs Regression: Difference Between them with definition & Comparison Chart; Author: Key Differences;https://www.youtube.com/watch?v=Ou2QGSJVd0U;License: Standard YouTube License, CC-BY
Correlation and Regression: Concepts with Illustrative examples; Author: LEARN & APPLY : Lean and Six Sigma;https://www.youtube.com/watch?v=xTpHD5WLuoA;License: Standard YouTube License, CC-BY