
Videos
The article “Experimental Design Approach for the Optimization of the Separation of Enantiomers in Preparative Liquid Chromatography” (S. Lai and Z. Lin. Separation Science and Technology, 2002: 847–875) describes an experiment involving a chemical process designed to separate enantiomers. A model was lit to estimate the cycle time (y) in terms of the flow rate (x1), sample concentration (x2), and mobile-phase composition (x3). The results of a least-squares lit are presented in the following table. (The article did not provide the value of the t statistic for the constant term.)
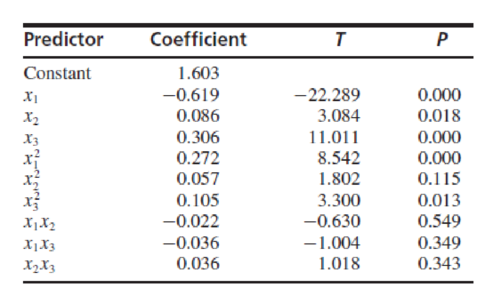
Of the following, which is the best next step in the analysis?
- i. Nothing needs to be done. This model is fine.
- ii. Drop
- iii. Drop
- iv. Drop
- v. Add cubic terms
Want to see the full answer?
Check out a sample textbook solution
Chapter 8 Solutions
Statistics for Engineers and Scientists
Additional Math Textbook Solutions
Essentials of Statistics (6th Edition)
Basic Business Statistics, Student Value Edition
Elementary Statistics: A Step By Step Approach
Business Statistics: A First Course (7th Edition)
Elementary Statistics Using The Ti-83/84 Plus Calculator, Books A La Carte Edition (5th Edition)
Elementary Statistics: Picturing the World (7th Edition)


- In "Orthogonal Design for Process Optimization and Its Application to Plasma Etching" (Solid State Technology, May 1987), G. Z. Yin and D. W. Jillie describe an experiment to determine the effect of C2Fe flow rate on the uniformity of the etch on a silicon wafer used in integrated circuit manufacturing. Three flow rates are used in the experiment, and the resulting uniformity (in percent) for six replicates is shown below. Observations C„F. Flow (SCCM) 2 3 4 5 125 2.5 4.4 2.6 3.2 3.2 4.0 160 4.8 4.4 4.8 4.2 3.6 4.2 200 4.6 3.3 2.8 3.4 4.2 5.3 (a) Does C,F, flow rate affect etch uniformity? Construct box plots to compare the factor levels and perform the analysis of variance. Use a = 0.05. There is that flow rate affects etch uniformity. (b) Do the residuals indicate any problems with the underlying assumptions? No. Statistical Tables and Charts Yes.arrow_forwardThe article "Simulation of the Hot Carbonate Process for Removal of CO, and H,S from Medium Btu Gas" (K. Park and T. Edgar, Energy Progress, 1984:174–180) presents an equation used to estimate the equilibrium vapor pressure of CO, in a potassium carbonate solution. The actual equilibrium pressure (in kPa) was measured in nine different reactions and compared with the value estimated from the equation. The results are presented in the following table: Reaction Estimated Experimental Difference 45.10 42.95 2.15 2 85.77 79.98 5.79 3 151.84 146.17 5.67 4. 244.30 228.22 16.08 5 257.67 240.63 17.04 6 44.32 41.99 2.33 84.41 82.05 2.36 8 150.47 149.62 0.85 253.81 245.45 8.36 Find a 95% confidence interval for the mean difference between the estimated and actual pressures.arrow_forwardThe article "Influence of Freezing Temperature on Hydraulic Conductivity of Silty Clay" (J. Konrad and M. Samson, Journal of Geotechnical and Geoenvironmental Engineering, 2000:180–187) describes a study of factors affecting hydraulic conductivity of soils. The measurements of hydraulic conductivity in units of 108 cm/s (y), initial void ratio (x), and thawed void ratio (x2) for 12 specimens of silty clay are presented in the following table. y 1.01 1.12 1.04 1.30 1.01 1.04 0.955 1.15 1.23 1.28 1.23 1.30 0.84 0.88 0.85 0.95 0.88 0.86 0.85 0.89 0.90 0.94 0.88 0.90 X1 0.81 0.85 0.87 0.92 0.84 0.85 0.85 0.86 0.85 0.92 0.88 0.92 X2 Fit the model y = Bo + fix1 + e. For each coefficient, test the null hypothesis that it is equal to 0. Fit the model y = Bo + Bzx2 + e. For each coefficient, test the null hypothesis that it is equal to 0. Fit the model y = Bo + BzX1 + Bzxz + e. For each coefficient, test the null hypothesis that it is equal to 0. d. Which of the models in parts (a) to (c) is…arrow_forward
- The article "Experimental Measurement of Radiative Heat Transfer in Gas-Solid Suspension Flow System" (G. Han, K. Tuzla, and J. Chen, AIChe Journal, 2002:1910- 1916) discusses the calibration of a radiometer. Several measurements were made on the electromotive force readings of the radiometer (in volts) and the radiation flux (in kilowatts per square meter). The results (read from a graph) are presented in the following table. Heat flux (y) 15 31 51 55 67 89 Signal output (x) 1.08 2.42 4.17 4.46 5.17 6.92 Compute the least-squares line for predicting heat flux from the signal output. If the radiometer reads 3.00 V, predict the heat flux. If the radiometer reads 8.00 V, should the heat flux be predicted? If so, predict it. If not, explain why. C.arrow_forwardWrinkle recovery angle and tensile strength are the two most important characteristics for evaluating the performance of crosslinked cotton fabric. An increase in the degree of crosslinking, as determined by ester carboxyl band absorbance, improves the wrinkle resistance of the fabric (at the expense of reducing mechanical strength). The accompanying data on x = absorbance and y = wrinkle resistance angle was read from a graph in the paper "Predicting the Performance of Durable Press Finished Cotton Fabric with Infrared Spectroscopy".† x 0.115 0.126 0.183 0.246 0.282 0.344 0.355 0.452 0.491 0.554 0.651 y 334 342 355 363 365 372 381 392 400 412 420 Here is regression output from Minitab: Predictor Constant absorb S = 3.60498 Coef 321.878 156.711 SOURCE Regression Residual Error Total SE Coef 2.483 6.464 R-Sq = 98.5% DF 1 9 10 SS 7639.0 117.0 7756.0 T 129.64 24.24 0.000 0.000 R-Sq (adj) = 98.3% MS 7639.0 13.0 F P 587.81 (a) Does the simple linear regression model appear to be…arrow_forwardWrinkle recovery angle and tensile strength are the two most important characteristics for evaluating the performance of crosslinked cotton fabric. An increase in the degree of crosslinking, as determined by ester carboxyl band absorbance, improves the wrinkle resistance of the fabric (at the expense of reducing mechanical strength). The accompanying data on x = absorbance and y = wrinkle resistance angle was read from a graph in the paper "Predicting the Performance of Durable Press Finished Cotton Fabric with Infrared Spectroscopy".t 半 0.115 0.126 0.183 0.246 0.282 0.344 0.355 0.452 0.491 0.554 0.651 334 342 355 363 365 372 381 392 400 412 420 Here is regression output from Minitab: Predictor Coef SE Coef P Constant 321.878 2.483 129.64 0.000 absorb 156.711 6.464 24.24 0.000 S = 3.60498 R-Sq = 98.5% R-Są (adj) - 98.3% SOURCE DF MS F P Regression 1 7639.0 7639.0 587.81 0.000 Residual Error 9 117.0 13.0 Total 10 7756.0 (a) Does the simple linear regression model appear to be…arrow_forward
- Wrinkle recovery angle and tensile strength are the two most important characteristics for evaluating the performance of crosslinked cotton fabric. An increase in the degree of crosslinking, as determined by ester carboxyl band absorbance, improves the wrinkle resistance of the fabric (at the expense of reducing mechanical strength). The accompanying data on x = absorbance and y = wrinkle resistance angle was read from a graph in the paper "Predicting the Performance of Durable Press Finished Cotton Fabric with Infrared Spectroscopy".t x 0.115 0.126 0.183 0.246 0.282 0.344 0.355 0.452 0.491 0.554 0.651 y 334 342 355 363 365 372 381 400 392 412 420 Here is regression output from Minitab: Predictor Constant absorb S = 3.60498 Coef 321.878 156.711 SOURCE Regression Residual Error Total R-Sq= 98.5% DF SE Coef 2.483 6.464 1 9 10 SS 7639.0 117.0 7756..0 T 129.64 24.24 P 0.000 0.000. R-Sq (adj) 98.3% MS 7639.0 13.0 F 587.81 (a) Does the simple linear regression model appear to be appropriate?…arrow_forwardThe article "Mathematical Modeling of the Argon-Oxygen Decarburization Refining Process of Stainless Steel: Part II. Application of the Model to Industrial Practice" (J. Wei and D. Zhu, Metallurgical and Materials Transactions B, 2001:212-217) presents the carbon content (in mass %) and bath temperature (in K) for 32 heats of austenitic stainless steel. These data are shown in the following table. Carbon % Temp. 1975 19 23 1947 22 1954 16 1992 17 1965 18 1971 12 2046 24 1945 17 1984 20 1991arrow_forwardQ3) An experiment was carried out to investigate variation of solubility of chemical X in water. The quantities in kg that dissolved in 1 liter at various temperatures are show in the table (1). Table (1) Temperature C Mass of X 2.1 2.6 2.9 3.3 15 20 25 30 35 4 50 5.1 70 7 Use the proper methods to answer the following questions: a) Draw a scatter diagram to show the data. b) Estimate the temperature based on the mass of X. c) What quantity might be expected to dissolve at 42 C? Find the quantity that your cquation indicates would dissolve at 10 C and comment on your answer.arrow_forward
- The article “Wastewater Treatment Sludge as a Raw Material for the Production of Bacillus thuringiensis Based Biopesticides” (M. Tirado Montiel, R. Tyagi, and J. Valero, Water Research, 2001:3807–3816) presents measurements of total solids, in g/L, for seven sludge specimens. The results (rounded to the nearest gram) are 20, 5, 25, 43, 24, 21, and 32. Assume the distribution of total solids is approximately symmetric. a) Can you conclude that the mean concentration of total solids is greater than 14 g/L? Compute the appropriate test statistic and find the P-value. b) Can you conclude that the mean concentration of total solids is less than 30 g/L? Compute the appropriate test statistic and find the P-value. c) An environmental engineer claims that the mean concentration of total solids is equal to 18 g/L. Can you conclude that the claim is false?arrow_forwardLaetisaric acid is a compound that holds promise for control of fungus diseases in crop plants. The accompanying data show the results of growing the fungus Pythium (y) in various concentrations of laetisaric acid (x). Laetisaric acid concentration (uG/mL) Fungus growth (mm) 0. 33.3 31.0 29.8 27.8 6. 28.0 6. 29.0 10 25.5 10 23.8 20 18.3 20 15.5 30 11.7 30 10.0 Mean 11.500 23.642 Standard deviation 10.884 7.8471 T =-0.98754 %3D a. State the linear regression equation, and with a 0.01 level of significance, predict the amount (in mm) of fungus growth when 25 uG/mL laetisaric acid is applied. Assume the pairs of data follow a bivariate normal distribution and that the scatterplot shows no evidence of a non-linear relationship in the data. b. Determine the percentage of the variation in fungus growth that is explained by the linear relationship between laetisaric acid concentration and fungus growth. Attack Eilarrow_forwardThe depth of wetting of a soil is the depth to which water content will increase owing to extemal factors. The article "Discussion of Method for Evaluation of Depth of Wetting in Residential Areas" (J. Nelson, K. Chao, and D. Overton, Journal of Geotechnical and Geoenvironmental Engineering, 2011:293-296) discusses the relationship between depth of wetting beneath a structure and the age of the structure. The article presents measurements of depth of wetting, in meters, and the ages, in years, of 21 houses, as shown in the following table. Age Depth 7.6 4 4.6 6.1 9.1 3 4.3 7.3 5.2 10.4 15.5 5.8 10.7 4 5.5 6.1 10.7 10.4 4.6 7.0 6.1 14 16.8 10 9.1 8.8 Compute the least-squares line for predicting depth of wetting (y) from age (x). b. Identify a point with an unusually large x-value. Compute the least-squares line that results from deletion of this point. Identify another point which can be classified as an outlier. Compute the least-squares line that results from deletion of the outlier,…arrow_forward
 MATLAB: An Introduction with ApplicationsStatisticsISBN:9781119256830Author:Amos GilatPublisher:John Wiley & Sons Inc
 Probability and Statistics for Engineering and th...StatisticsISBN:9781305251809Author:Jay L. DevorePublisher:Cengage Learning
 Statistics for The Behavioral Sciences (MindTap C...StatisticsISBN:9781305504912Author:Frederick J Gravetter, Larry B. WallnauPublisher:Cengage Learning
 Elementary Statistics: Picturing the World (7th E...StatisticsISBN:9780134683416Author:Ron Larson, Betsy FarberPublisher:PEARSON
 The Basic Practice of StatisticsStatisticsISBN:9781319042578Author:David S. Moore, William I. Notz, Michael A. FlignerPublisher:W. H. Freeman
 Introduction to the Practice of StatisticsStatisticsISBN:9781319013387Author:David S. Moore, George P. McCabe, Bruce A. CraigPublisher:W. H. Freeman