The Practice of Statistics for AP - 4th Edition
4th Edition
ISBN: 9781429245593
Author: Starnes, Daren S., Yates, Daniel S., Moore, David S.
Publisher: Macmillan Higher Education
bartleby

Concept explainers

bartleby

Videos

Question
Book Icon
Chapter 3.1, Problem 4E

(a)

To determine

To find: whether the plot shows a positive or negative association between the variables

(a)

Expert Solution
Check Mark

Answer to Problem 4E

The plot shows a negative association between the two variables.

Explanation of Solution

Given:

  The Practice of Statistics for AP - 4th Edition, Chapter 3.1, Problem 4E , additional homework tip  1

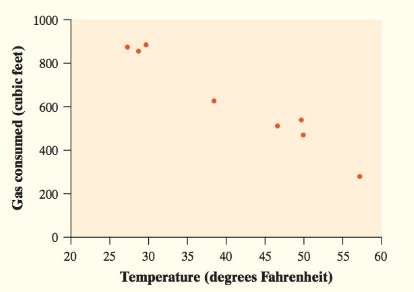
The figure below shows a scatterplot of Temperature (degrees Fahrenheit) and Gas consumed (cubic feet). We think that “Tempreature” will help explain “Gas consumed”. So “Tempreature” is the explanatory variable and “Gas consumed” is the response variable. We want to see how Gas consumed changes when Tempreature changes, so we put Tempreature (the explanatory variable) on the horizontal axis and Gas consumed (the response variable) on the vertical axis.

The plot shows a negative association between the two variables.

(b)

To determine

To find:the form of the relationship and explain whether it is very strong.

(b)

Expert Solution
Check Mark

Answer to Problem 4E

The form of the relationship is linear. The relationship is moderately strong

Explanation of Solution

The form of the relationship is linear. That is, the overall pattern follows a straight line from upper left to lower right. The relationship is moderately strong because the points don’t deviate greatly from line. There are no obvious outliers.

(c)

To determine

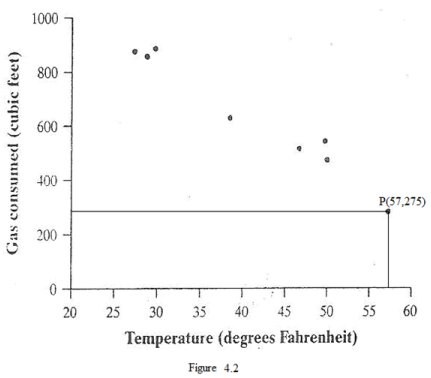
To explain:the point at the bottom right of the plot

(c)

Expert Solution
Check Mark

Answer to Problem 4E

The point P shows that Joan uses 275 cubic feet gas (approx.) to maintain the temperature 57 degrees Fahrenheit.

Explanation of Solution

In Figure point P , when perpendicular is drawn from point P to X axis and Y axis, the coordinate of point P is approximately (57,275) . This shows that Joan uses 275 cubic feet gas (approx.) to maintain the temperature 57 degrees Fahrenheit.

  The Practice of Statistics for AP - 4th Edition, Chapter 3.1, Problem 4E , additional homework tip  2

Chapter 3 Solutions

The Practice of Statistics for AP - 4th Edition

Ch. 3.1 - Prob. 2ECh. 3.1 - Prob. 3ECh. 3.1 - Prob. 4ECh. 3.1 - Prob. 5ECh. 3.1 - Prob. 6ECh. 3.1 - Prob. 7ECh. 3.1 - Prob. 8ECh. 3.1 - Prob. 9ECh. 3.1 - Prob. 10ECh. 3.1 - Prob. 11ECh. 3.1 - Prob. 12ECh. 3.1 - Prob. 13ECh. 3.1 - Prob. 14ECh. 3.1 - Prob. 15ECh. 3.1 - Prob. 16ECh. 3.1 - Prob. 17ECh. 3.1 - Prob. 18ECh. 3.1 - Prob. 19ECh. 3.1 - Prob. 20ECh. 3.1 - Prob. 21ECh. 3.1 - Prob. 22ECh. 3.1 - Prob. 23ECh. 3.1 - Prob. 24ECh. 3.1 - Prob. 25ECh. 3.1 - Prob. 26ECh. 3.1 - Prob. 27ECh. 3.1 - Prob. 28ECh. 3.1 - Prob. 29ECh. 3.1 - Prob. 30ECh. 3.1 - Prob. 31ECh. 3.1 - Prob. 32ECh. 3.1 - Prob. 33ECh. 3.1 - Prob. 34ECh. 3.2 - Prob. 1.3CYUCh. 3.2 - Prob. 1.4CYUCh. 3.2 - Prob. 2.1CYUCh. 3.2 - Prob. 3.1CYUCh. 3.2 - Prob. 3.2CYUCh. 3.2 - Prob. 3.3CYUCh. 3.2 - Prob. 4.1CYUCh. 3.2 - Prob. 4.2CYUCh. 3.2 - Prob. 5.1CYUCh. 3.2 - Prob. 5.2CYUCh. 3.2 - Prob. 35ECh. 3.2 - Prob. 36ECh. 3.2 - Prob. 37ECh. 3.2 - Prob. 38ECh. 3.2 - Prob. 39ECh. 3.2 - Prob. 40ECh. 3.2 - Prob. 41ECh. 3.2 - Prob. 42ECh. 3.2 - Prob. 43ECh. 3.2 - Prob. 44ECh. 3.2 - Prob. 45ECh. 3.2 - Prob. 46ECh. 3.2 - Prob. 47ECh. 3.2 - Prob. 48ECh. 3.2 - Prob. 49ECh. 3.2 - Prob. 50ECh. 3.2 - Prob. 51ECh. 3.2 - Prob. 52ECh. 3.2 - Prob. 53ECh. 3.2 - Prob. 54ECh. 3.2 - Prob. 55ECh. 3.2 - Prob. 56ECh. 3.2 - Prob. 57ECh. 3.2 - Prob. 58ECh. 3.2 - Prob. 59ECh. 3.2 - Prob. 60ECh. 3.2 - Prob. 61ECh. 3.2 - Prob. 62ECh. 3.2 - Prob. 63ECh. 3.2 - Prob. 64ECh. 3.2 - Prob. 65ECh. 3.2 - Prob. 66ECh. 3.2 - Prob. 67ECh. 3.2 - Prob. 68ECh. 3.2 - Prob. 69ECh. 3.2 - Prob. 70ECh. 3.2 - Prob. 71ECh. 3.2 - Prob. 72ECh. 3.2 - Prob. 73ECh. 3.2 - Prob. 74ECh. 3.2 - Prob. 75ECh. 3.2 - Prob. 76ECh. 3.2 - Prob. 77ECh. 3.2 - Prob. 78ECh. 3.2 - Prob. 79ECh. 3.2 - Prob. 80ECh. 3.2 - Prob. 81ECh. 3 - Prob. 1CRECh. 3 - Prob. 2CRECh. 3 - Prob. 3CRECh. 3 - Prob. 4CRECh. 3 - Prob. 5CRECh. 3 - Prob. 6CRECh. 3 - Prob. 7CRECh. 3 - Prob. 1PTCh. 3 - Prob. 2PTCh. 3 - Prob. 3PTCh. 3 - Prob. 4PTCh. 3 - Prob. 5PTCh. 3 - Prob. 6PTCh. 3 - Prob. 7PTCh. 3 - Prob. 8PTCh. 3 - Prob. 9PTCh. 3 - Prob. 10PTCh. 3 - Prob. 11PTCh. 3 - Prob. 12PTCh. 3 - Prob. 13PT
Knowledge Booster
Background pattern image
Statistics
Learn more about
Need a deep-dive on the concept behind this application? Look no further. Learn more about this topic, statistics and related others by exploring similar questions and additional content below.
Recommended textbooks for you
Text book image
MATLAB: An Introduction with Applications
Statistics
ISBN:9781119256830
Author:Amos Gilat
Publisher:John Wiley & Sons Inc
Text book image
Probability and Statistics for Engineering and th...
Statistics
ISBN:9781305251809
Author:Jay L. Devore
Publisher:Cengage Learning
Text book image
Statistics for The Behavioral Sciences (MindTap C...
Statistics
ISBN:9781305504912
Author:Frederick J Gravetter, Larry B. Wallnau
Publisher:Cengage Learning
Text book image
Elementary Statistics: Picturing the World (7th E...
Statistics
ISBN:9780134683416
Author:Ron Larson, Betsy Farber
Publisher:PEARSON
Text book image
The Basic Practice of Statistics
Statistics
ISBN:9781319042578
Author:David S. Moore, William I. Notz, Michael A. Fligner
Publisher:W. H. Freeman
Text book image
Introduction to the Practice of Statistics
Statistics
ISBN:9781319013387
Author:David S. Moore, George P. McCabe, Bruce A. Craig
Publisher:W. H. Freeman
Sampling Methods and Bias with Surveys: Crash Course Statistics #10; Author: CrashCourse;https://www.youtube.com/watch?v=Rf-fIpB4D50;License: Standard YouTube License, CC-BY
Statistics: Sampling Methods; Author: Mathispower4u;https://www.youtube.com/watch?v=s6ApdTvgvOs;License: Standard YouTube License, CC-BY