
Concept explainers
Videos
(a)
To make: a
(a)
Answer to Problem 67E

Explanation of Solution
Given:
| Percent return | 74 | 66 | 81 | 52 | 73 | 62 | 52 | 45 | 62 | 46 | 60 | 46 | 38 |
| New adults | 5 | 6 | 8 | 11 | 12 | 15 | 16 | 17 | 18 | 18 | 19 | 20 | 20 |
Calculation:
We put percent return (the explanatory variable) on the horizontal axis and new adults (the response variable) on the vertical axis.
The below figure is the scatter plot for the given data.
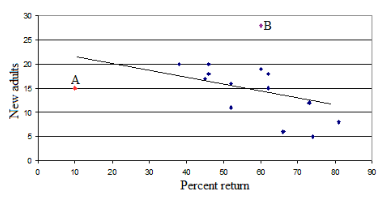
From the scatter plot. Point A and B are identified as outliers. Point A is the outlier in the X direction of the scatterplot.
Conclusion:
Thus, the required scatterplot is drawn.
(b)
To find: the point which is more influential for the regression line.
(b)
Answer to Problem 67E
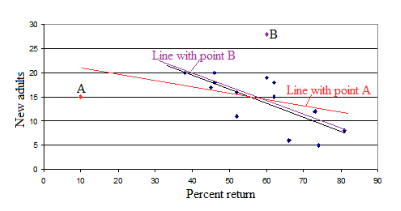
Point A is more influential because the least-squares regression line deviates more strongly from the line with the original points where A is included.
Explanation of Solution
Calculation:
The below figure shows the results of removing each of these points on the
Conclusion:
Thus, point A is more influential.
Chapter 3 Solutions
The Practice of Statistics for AP - 4th Edition
Additional Math Textbook Solutions
Essentials of Statistics (6th Edition)
Statistics for Psychology
Basic Business Statistics, Student Value Edition (13th Edition)
Elementary Statistics (13th Edition)
Basic Business Statistics, Student Value Edition
Elementary Statistics: Picturing the World (7th Edition)


 MATLAB: An Introduction with ApplicationsStatisticsISBN:9781119256830Author:Amos GilatPublisher:John Wiley & Sons Inc
 Probability and Statistics for Engineering and th...StatisticsISBN:9781305251809Author:Jay L. DevorePublisher:Cengage Learning
 Statistics for The Behavioral Sciences (MindTap C...StatisticsISBN:9781305504912Author:Frederick J Gravetter, Larry B. WallnauPublisher:Cengage Learning
 Elementary Statistics: Picturing the World (7th E...StatisticsISBN:9780134683416Author:Ron Larson, Betsy FarberPublisher:PEARSON
 The Basic Practice of StatisticsStatisticsISBN:9781319042578Author:David S. Moore, William I. Notz, Michael A. FlignerPublisher:W. H. Freeman
 Introduction to the Practice of StatisticsStatisticsISBN:9781319013387Author:David S. Moore, George P. McCabe, Bruce A. CraigPublisher:W. H. Freeman