
Concept explainers
Videos
(a)
To identify: the unusual point and explain.
(a)
Answer to Problem 12PT
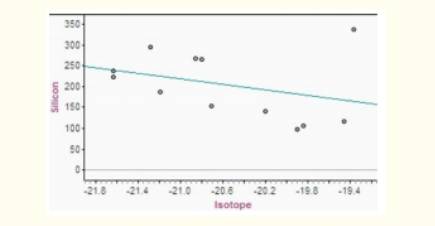
Point A can be described as an outlier/unusual point since it falls outside of the overall pattern.
Explanation of Solution
Given:
From the
(b) (i)
To describe: the effect on the
(b) (i)
Answer to Problem 12PT
Correlation will increase.
Explanation of Solution
From part (A), we can see that point A is an outlier.
If point A is removed from the scatter plot, correlation will increase since remaining points are more tightly clustered in a linear pattern.
(b) (ii)
To describe: the effect on the slope and y intercept of the least-squares line.
(b) (ii)
Answer to Problem 12PT
The Y-intercept increase when the extreme value is removed from the scatter plot.
Explanation of Solution
Point A (Value corresponding to isotope value -19.3 and silicon value of 345) is extreme in the X direction as well as in Y direction with no other point near it. So it pulls the regression line toward itself.
If we remove the extreme value which corresponds to the higher value of silicon, the slope of regression line would decrease as the regression line move towards X-axis.
Also, the Y-intercept increase when the extreme value is removed from the scatter plot.
Chapter 3 Solutions
The Practice of Statistics for AP - 4th Edition
Additional Math Textbook Solutions
Elementary Statistics: Picturing the World (6th Edition)
Basic Business Statistics, Student Value Edition
Statistical Reasoning for Everyday Life (5th Edition)
Elementary Statistics (13th Edition)
STATS:DATA+MODELS-W/DVD
Elementary Statistics Using Excel (6th Edition)


 MATLAB: An Introduction with ApplicationsStatisticsISBN:9781119256830Author:Amos GilatPublisher:John Wiley & Sons Inc
 Probability and Statistics for Engineering and th...StatisticsISBN:9781305251809Author:Jay L. DevorePublisher:Cengage Learning
 Statistics for The Behavioral Sciences (MindTap C...StatisticsISBN:9781305504912Author:Frederick J Gravetter, Larry B. WallnauPublisher:Cengage Learning
 Elementary Statistics: Picturing the World (7th E...StatisticsISBN:9780134683416Author:Ron Larson, Betsy FarberPublisher:PEARSON
 The Basic Practice of StatisticsStatisticsISBN:9781319042578Author:David S. Moore, William I. Notz, Michael A. FlignerPublisher:W. H. Freeman
 Introduction to the Practice of StatisticsStatisticsISBN:9781319013387Author:David S. Moore, George P. McCabe, Bruce A. CraigPublisher:W. H. Freeman