
Concept explainers
Videos
(a)
To make: a
(a)
Answer to Problem 66E

Explanation of Solution
Given:
| subject | HbA | FPG | subject | HbA | FPG |
| 1 | 6.1 | 141 | 10 | 8.7 | 172 |
| 2 | 6.3 | 158 | 11 | 9.4 | 200 |
| 3 | 6.4 | 112 | 12 | 10.4 | 271 |
| 4 | 6.8 | 153 | 13 | 10.6 | 103 |
| 5 | 7.0 | 134 | 14 | 10.7 | 172 |
| 6 | 7.1 | 95 | 15 | 10.7 | 359 |
| 7 | 7.5 | 96 | 16 | 11.2 | 145 |
| 8 | 7.7 | 78 | 17 | 13.7 | 147 |
| 9 | 7.9 | 148 | 18 | 19.3 | 255 |
Calculation:
Put HbA (the explanatory variable) on the horizontal axis and FPG (the response variable) on the vertical axis.
Using the MINITAB, the scatterplot for the given data is shown below:
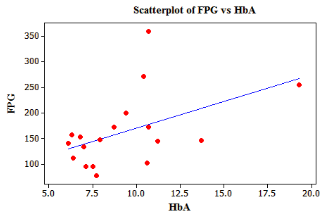
The graph shows a clear direction: the overall pattern moves from lower left to upper right. That is, higher HbA tend to have higher FPG. We call this a positive association between the two variables. The form of the relationship is linear. That is, the overall pattern follows a straight line from lower left to upper right. The relationship is weak because the points deviate greatly from line and there are some outliers.
Conclusion:
Therefore, the required scatterplot is drawn.
(b)
To find: the
(b)
Answer to Problem 66E
The correlation r with all 18 subjects is r = 0.482
The correlation r without subject 15 is r =0.568
The correlation r without subject 18 is r =0.384
Explanation of Solution
Calculation:
Using the MINITAB, the correlation r with all 18 subjects is r = 0.482
The correlation r without subject 15 is r =0.568
The correlation r without subject 18 is r =0.384
The correlation without subject 15 and without subject 18 is r = 0.324
When we remove outlier subject 15, Correlation increases by 0.086. However, removing subject
15 has little effect on the correlation. Because of subject 15's extreme position on HbA scale; this point has a strong influence on the position of the regression line. When we remove outlier subject 18, Correlation decreases by 0.098. Just one outlier can be entirely responsible for a high value of the correlation that otherwise (without the outlier) would be very low. Needless to say, one should never base important conclusions on the value of the
Both subject 15 and 18 are influential, because the
Conclusion:
Therefore,
The correlation r with all 18 subjects is r = 0.482
The correlation r without subject 15 is r =0.568
The correlation r without subject 18 is r =0.384
(c)
To explain: whether subject 15 or subject 18 are strongly influential for the least-squares line
(c)
Answer to Problem 66E
Subject 15 and subject 18 both are influential.
Explanation of Solution
Calculation:
The below figure shows the least-square lines with all 18 subjects, without subject 15 and without subject 18.
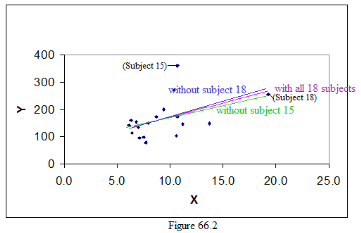
Here it is seen that subject 18 has great importance. This is the point which we can say a good outlier because this point stretches the pattern to upper right direction. If we remove this point correlation drops because rest of the points does not show any clear pattern. Subject 15 has a very large residual because this point lies far from the regression line. Least-squares lines make the sum of squares of the vertical distances to the points as small as possible. A point that is extreme in the X direction with no other points near it pulls the line toward itself. It is called points influential. It reduces the slope of the line.
Conclusion:
Therefore, subject 15 and subject 18 both are influential.
Chapter 3 Solutions
The Practice of Statistics for AP - 4th Edition
Additional Math Textbook Solutions
Basic Business Statistics, Student Value Edition (13th Edition)
Elementary Statistics: Picturing the World (6th Edition)
Introductory Statistics (2nd Edition)
An Introduction to Mathematical Statistics and Its Applications (6th Edition)
Elementary Statistics: Picturing the World (7th Edition)


 MATLAB: An Introduction with ApplicationsStatisticsISBN:9781119256830Author:Amos GilatPublisher:John Wiley & Sons Inc
 Probability and Statistics for Engineering and th...StatisticsISBN:9781305251809Author:Jay L. DevorePublisher:Cengage Learning
 Statistics for The Behavioral Sciences (MindTap C...StatisticsISBN:9781305504912Author:Frederick J Gravetter, Larry B. WallnauPublisher:Cengage Learning
 Elementary Statistics: Picturing the World (7th E...StatisticsISBN:9780134683416Author:Ron Larson, Betsy FarberPublisher:PEARSON
 The Basic Practice of StatisticsStatisticsISBN:9781319042578Author:David S. Moore, William I. Notz, Michael A. FlignerPublisher:W. H. Freeman
 Introduction to the Practice of StatisticsStatisticsISBN:9781319013387Author:David S. Moore, George P. McCabe, Bruce A. CraigPublisher:W. H. Freeman