The Practice of Statistics for AP - 4th Edition
4th Edition
ISBN: 9781429245593
Author: Starnes, Daren S., Yates, Daniel S., Moore, David S.
Publisher: Macmillan Higher Education
bartleby

Concept explainers

bartleby

Videos

Question
Book Icon
Chapter 3.1, Problem 25E
To determine

To find: what is responsible for the effect of correlation.

Expert Solution & Answer
Check Mark

Answer to Problem 25E

In scatterplot that all points are in line except (5, 1), this is an outlier. The remaining 5 points are more tightly clustered in a straight line.

Explanation of Solution
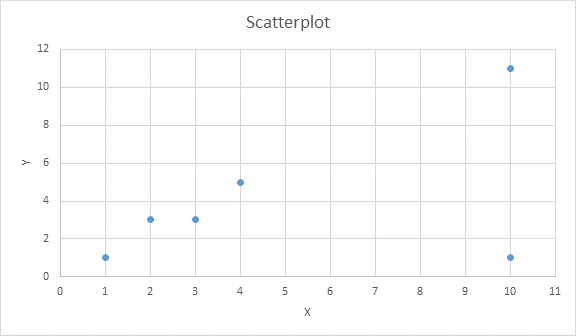
Given:

    x12341010
    y1335111

  The Practice of Statistics for AP - 4th Edition, Chapter 3.1, Problem 25E

We assume that X will help explain Y . So X is the explanatory and Y is the response variable. We want to see Y changes when X changes, so we put X (the explanatoryvariable) on the horizontal axis and Y (the response variable) on the vertical axis. From the above scatter plot we observe that, the overall pattern moves from lower left to upper right. We call this a positive association between the two variables. The form of the relationship is liner. That is, the overall pattern follows as straight line from lower left to upper right. The correlation of 0.5 shows there is a moderately strong, positive linear relationship between X and Y . We can clearly see in scatterplot that all points are in line except (5, 1), this is an outlier. This point is responsible for reducing the correlation despite a strong straight - line relationship. Removing the outlier would definitely increase the correlation since remaining 5 points are more tightly clustered in a straight line.

Chapter 3 Solutions

The Practice of Statistics for AP - 4th Edition

Ch. 3.1 - Prob. 2ECh. 3.1 - Prob. 3ECh. 3.1 - Prob. 4ECh. 3.1 - Prob. 5ECh. 3.1 - Prob. 6ECh. 3.1 - Prob. 7ECh. 3.1 - Prob. 8ECh. 3.1 - Prob. 9ECh. 3.1 - Prob. 10ECh. 3.1 - Prob. 11ECh. 3.1 - Prob. 12ECh. 3.1 - Prob. 13ECh. 3.1 - Prob. 14ECh. 3.1 - Prob. 15ECh. 3.1 - Prob. 16ECh. 3.1 - Prob. 17ECh. 3.1 - Prob. 18ECh. 3.1 - Prob. 19ECh. 3.1 - Prob. 20ECh. 3.1 - Prob. 21ECh. 3.1 - Prob. 22ECh. 3.1 - Prob. 23ECh. 3.1 - Prob. 24ECh. 3.1 - Prob. 25ECh. 3.1 - Prob. 26ECh. 3.1 - Prob. 27ECh. 3.1 - Prob. 28ECh. 3.1 - Prob. 29ECh. 3.1 - Prob. 30ECh. 3.1 - Prob. 31ECh. 3.1 - Prob. 32ECh. 3.1 - Prob. 33ECh. 3.1 - Prob. 34ECh. 3.2 - Prob. 1.3CYUCh. 3.2 - Prob. 1.4CYUCh. 3.2 - Prob. 2.1CYUCh. 3.2 - Prob. 3.1CYUCh. 3.2 - Prob. 3.2CYUCh. 3.2 - Prob. 3.3CYUCh. 3.2 - Prob. 4.1CYUCh. 3.2 - Prob. 4.2CYUCh. 3.2 - Prob. 5.1CYUCh. 3.2 - Prob. 5.2CYUCh. 3.2 - Prob. 35ECh. 3.2 - Prob. 36ECh. 3.2 - Prob. 37ECh. 3.2 - Prob. 38ECh. 3.2 - Prob. 39ECh. 3.2 - Prob. 40ECh. 3.2 - Prob. 41ECh. 3.2 - Prob. 42ECh. 3.2 - Prob. 43ECh. 3.2 - Prob. 44ECh. 3.2 - Prob. 45ECh. 3.2 - Prob. 46ECh. 3.2 - Prob. 47ECh. 3.2 - Prob. 48ECh. 3.2 - Prob. 49ECh. 3.2 - Prob. 50ECh. 3.2 - Prob. 51ECh. 3.2 - Prob. 52ECh. 3.2 - Prob. 53ECh. 3.2 - Prob. 54ECh. 3.2 - Prob. 55ECh. 3.2 - Prob. 56ECh. 3.2 - Prob. 57ECh. 3.2 - Prob. 58ECh. 3.2 - Prob. 59ECh. 3.2 - Prob. 60ECh. 3.2 - Prob. 61ECh. 3.2 - Prob. 62ECh. 3.2 - Prob. 63ECh. 3.2 - Prob. 64ECh. 3.2 - Prob. 65ECh. 3.2 - Prob. 66ECh. 3.2 - Prob. 67ECh. 3.2 - Prob. 68ECh. 3.2 - Prob. 69ECh. 3.2 - Prob. 70ECh. 3.2 - Prob. 71ECh. 3.2 - Prob. 72ECh. 3.2 - Prob. 73ECh. 3.2 - Prob. 74ECh. 3.2 - Prob. 75ECh. 3.2 - Prob. 76ECh. 3.2 - Prob. 77ECh. 3.2 - Prob. 78ECh. 3.2 - Prob. 79ECh. 3.2 - Prob. 80ECh. 3.2 - Prob. 81ECh. 3 - Prob. 1CRECh. 3 - Prob. 2CRECh. 3 - Prob. 3CRECh. 3 - Prob. 4CRECh. 3 - Prob. 5CRECh. 3 - Prob. 6CRECh. 3 - Prob. 7CRECh. 3 - Prob. 1PTCh. 3 - Prob. 2PTCh. 3 - Prob. 3PTCh. 3 - Prob. 4PTCh. 3 - Prob. 5PTCh. 3 - Prob. 6PTCh. 3 - Prob. 7PTCh. 3 - Prob. 8PTCh. 3 - Prob. 9PTCh. 3 - Prob. 10PTCh. 3 - Prob. 11PTCh. 3 - Prob. 12PTCh. 3 - Prob. 13PT
Knowledge Booster
Background pattern image
Statistics
Learn more about
Need a deep-dive on the concept behind this application? Look no further. Learn more about this topic, statistics and related others by exploring similar questions and additional content below.
Recommended textbooks for you
Text book image
MATLAB: An Introduction with Applications
Statistics
ISBN:9781119256830
Author:Amos Gilat
Publisher:John Wiley & Sons Inc
Text book image
Probability and Statistics for Engineering and th...
Statistics
ISBN:9781305251809
Author:Jay L. Devore
Publisher:Cengage Learning
Text book image
Statistics for The Behavioral Sciences (MindTap C...
Statistics
ISBN:9781305504912
Author:Frederick J Gravetter, Larry B. Wallnau
Publisher:Cengage Learning
Text book image
Elementary Statistics: Picturing the World (7th E...
Statistics
ISBN:9780134683416
Author:Ron Larson, Betsy Farber
Publisher:PEARSON
Text book image
The Basic Practice of Statistics
Statistics
ISBN:9781319042578
Author:David S. Moore, William I. Notz, Michael A. Fligner
Publisher:W. H. Freeman
Text book image
Introduction to the Practice of Statistics
Statistics
ISBN:9781319013387
Author:David S. Moore, George P. McCabe, Bruce A. Craig
Publisher:W. H. Freeman
Correlation Vs Regression: Difference Between them with definition & Comparison Chart; Author: Key Differences;https://www.youtube.com/watch?v=Ou2QGSJVd0U;License: Standard YouTube License, CC-BY
Correlation and Regression: Concepts with Illustrative examples; Author: LEARN & APPLY : Lean and Six Sigma;https://www.youtube.com/watch?v=xTpHD5WLuoA;License: Standard YouTube License, CC-BY