
Concept explainers
Videos
(a)
To find: the equation of the least-squares regression line for predicting brain activity
(a)
Answer to Problem 64E
Predicted Brain activity for social distress score 2.0 is -0.004516.
Explanation of Solution
Given:
Calculation:
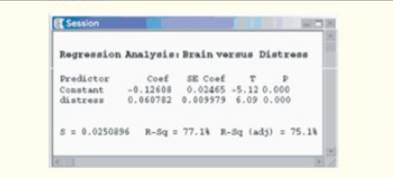
From the above output we can clearly see that
Slope
Y-intercept
The study records the brain activity. This is the outcome of the study, the brain activity is the response variable. Now, social distress is a second variable. The entire purpose of the study is to determine how, if at all, social distress affect the brain activity. Social distress is an explanatory variable. We will use social distress (explanatory variable or predictor) to predict brain activity (response or predicted variable). Brain activity is the dependent variable and social distress is the independent variable. The equation of the least-squares regression line for predicting the brain activity from the social distress is,
The brain activity for social distress score 2.0 is,
Predicted Brain activity for social distress score 2.0 is -0.004516.
Conclusion:
Thus, predicted Brain activity for social distress score 2.0 is -0.004516.
(b)
To find: the percent of the variation in brain activity
(b)
Answer to Problem 64E
77.1% of the variation in brain activity among these subjects is explained by the straight line relationship with social distress score.
Explanation of Solution
Calculation:
From the above output we can clearly see that
It is interpreted this by saying that 77.1% of the variation in brain activity among these subjects is explained by the straight line relationship with social distress score.
Conclusion:
Therefore, 77.1% of the variation in brain activity among these subjects is explained by the straight line relationship with social distress score.
(c)
To find: the
(c)
Answer to Problem 64E
Brain activity and the social distress are
Explanation of Solution
Calculation:
From the above figure we can clearly see that
Slope
This shows positive correlation between variables.
Correlation
Brain activity and the social distress are positively correlated and the coefficient of correlation between them is 0.878.
Conclusion:
Therefore, brain activity and the social distress are positively correlated and the coefficient of correlation between them is 0.878.
(d)
Tointerpret: the value of s
(d)
Answer to Problem 64E
The value of sis
Explanation of Solution
Calculation:
For these data the standard deviation of the residuals
The standard deviation of the residuals s measures the average size of the prediction errors (residuals) when using the regression line. The value of s
Conclusion:
Therefore, the value of s is
Chapter 3 Solutions
The Practice of Statistics for AP - 4th Edition
Additional Math Textbook Solutions
Elementary Statistics (13th Edition)
Statistics for Psychology
An Introduction to Mathematical Statistics and Its Applications (6th Edition)
Basic Business Statistics, Student Value Edition (13th Edition)
Basic Business Statistics, Student Value Edition


 MATLAB: An Introduction with ApplicationsStatisticsISBN:9781119256830Author:Amos GilatPublisher:John Wiley & Sons Inc
 Probability and Statistics for Engineering and th...StatisticsISBN:9781305251809Author:Jay L. DevorePublisher:Cengage Learning
 Statistics for The Behavioral Sciences (MindTap C...StatisticsISBN:9781305504912Author:Frederick J Gravetter, Larry B. WallnauPublisher:Cengage Learning
 Elementary Statistics: Picturing the World (7th E...StatisticsISBN:9780134683416Author:Ron Larson, Betsy FarberPublisher:PEARSON
 The Basic Practice of StatisticsStatisticsISBN:9781319042578Author:David S. Moore, William I. Notz, Michael A. FlignerPublisher:W. H. Freeman
 Introduction to the Practice of StatisticsStatisticsISBN:9781319013387Author:David S. Moore, George P. McCabe, Bruce A. CraigPublisher:W. H. Freeman