
Concept explainers
Videos
(a)
To make: a
(a)
Answer to Problem 53E
Explanation of Solution
Given:
| Percent return | 74 | 66 | 81 | 52 | 73 | 62 | 52 | 45 | 62 | 46 | 60 | 46 | 38 |
| New adults | 5 | 6 | 8 | 11 | 12 | 15 | 16 | 17 | 18 | 18 | 19 | 20 | 20 |
Calculation:
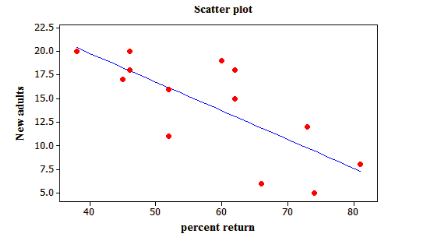
We put percent return (the explanatory variable) on the horizontal axis and new adults (the response variable) on the vertical axis.
The completed scatterplot for the given data is shown below.

Conclusion:
Hence, scatterplot is drawn.
(b)
To find:the equation of the least-squares regression line.
(b)
Answer to Problem 53E
The least square regression lie is
Explanation of Solution
Calculation:
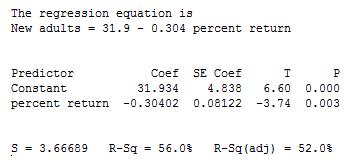
Using the MINITAB, we get the equation of the least-squares regression line is given below:
The least square regression lie is
Observe the above scatter plot for the data with regression line added.
Conclusion:
Hence, the least square regression lie is
(c)
To explain: the slope and y intercept of the regression line
(c)
Answer to Problem 53E
The slope b of above regression line (-0.304) is the rate at which the predicted response Y changes among the line as the explanatory variable X changes.
The Y intercept a of above regression line 31.9 is the predicted response Y when the explanatory variable
Explanation of Solution
The equation of the least-squares regression line,
Here the slope b of above regression line (-0.304) is the rate at which the predicted response Y changes among the line as the explanatory variable X changes. Specifically, b is the predicted changes Y when X increases by 1 unit. Here b is negative; this shows if percent return increases by 1 unit then new adult joins decreases by 0.304 units.
The Y intercept a of above regression line 31.9 is the predicted response Y when the explanatory variable
(d)
To predict: the how many birds will join another colony of sparrow hawks, to which 60% of the adults from the previous year return.
(d)
Answer to Problem 53E
This shows that 13.66 birds will join another colony of sparrow hawks, to which 60% of the adults from the previous year return.
Explanation of Solution
Calculation:
The equation of the least-squares regression line,
For
This shows that 13.66 birds will join another colony of sparrow hawks, to which 60% of the adults from the previous year return.
Conclusion:
Hence, this shows that 13.66 birds will join another colony of sparrow hawks, to which 60% of the adults from the previous year return.
Chapter 3 Solutions
The Practice of Statistics for AP - 4th Edition
Additional Math Textbook Solutions
An Introduction to Mathematical Statistics and Its Applications (6th Edition)
Statistics for Psychology
Essentials of Statistics (6th Edition)
Fundamentals of Statistics (5th Edition)
STATS:DATA+MODELS-W/DVD
Statistical Reasoning for Everyday Life (5th Edition)


 MATLAB: An Introduction with ApplicationsStatisticsISBN:9781119256830Author:Amos GilatPublisher:John Wiley & Sons Inc
 Probability and Statistics for Engineering and th...StatisticsISBN:9781305251809Author:Jay L. DevorePublisher:Cengage Learning
 Statistics for The Behavioral Sciences (MindTap C...StatisticsISBN:9781305504912Author:Frederick J Gravetter, Larry B. WallnauPublisher:Cengage Learning
 Elementary Statistics: Picturing the World (7th E...StatisticsISBN:9780134683416Author:Ron Larson, Betsy FarberPublisher:PEARSON
 The Basic Practice of StatisticsStatisticsISBN:9781319042578Author:David S. Moore, William I. Notz, Michael A. FlignerPublisher:W. H. Freeman
 Introduction to the Practice of StatisticsStatisticsISBN:9781319013387Author:David S. Moore, George P. McCabe, Bruce A. CraigPublisher:W. H. Freeman