
Concept explainers
Videos
(a)
To Explain: all five specimens come from the same species and make a
(a)
Answer to Problem 19E
Explanation of Solution
Given:
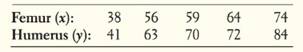
Calculation:
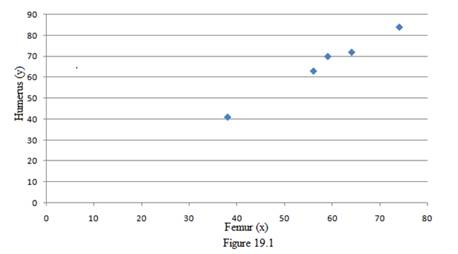
Using Excel, the scatterplot for the given data is,
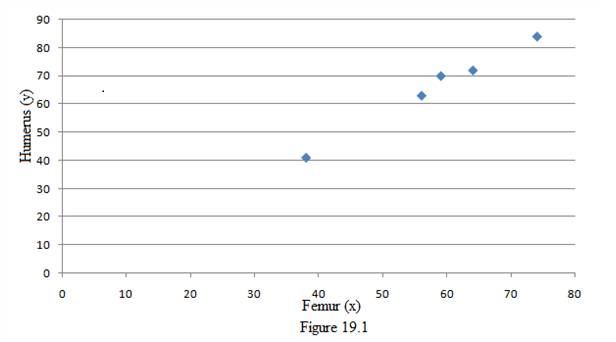
From the scatter plot, it is observed that the overall pattern moves from lower left to upper right. We call this a positive association between the two variables. The form of the relationship is linear. That is, the overall pattern follows a straight line from lower left to upper right. The relationship is very strong because the points don’t deviate greatly from line. Since scatter plot shows positive relationship between the lengths of a pair of bones from all individuals, we can say that all five specimens come from the same species.
Conclusion:
Hence, the scatter plot shows positive relationship between the lengths of a pair of bones from all the individuals.
(b)
To find: the
(b)
Answer to Problem 19E
The value of correlation is 0.995
The correlation of 0.995 confirms in the scatter plot: there is very strong, positive relationship between two variables.
Explanation of Solution
Calculation:
We find the
Where
Consider the following table:
| X | Y | ||||||
| 38 | 41 | 408.0 | 625.0 | -1.53 | -1.57 | 2.41 | |
| 56 | 63 | 4.8 | 9.0 | -0.17 | -0.19 | 0.03 | |
| 59 | 70 | 0.6 | 16.0 | 0.06 | 0.25 | 0.02 | |
| 64 | 72 | 33.6 | 36.0 | 0.44 | 0.38 | 0.17 | |
| 74 | 84 | 249.6 | 324.0 | 1.20 | 1.13 | 1.36 | |
| Total | 291 | 330 | 696.8 | 1010 | 0 | 0 | 3.98 |
=58.2
=66.0
=13.2
=15.9
= 0.995
The correlation of 0.995 confirms what we see in the scatter plot: there is very strong, positive relationship between two variables. Removing the outlier (59, 70) would increase the correlation because remaining 4 points are tightly clustered in a linear pattern.
Conclusion:
Hence,
the value of correlation is 0.995
The correlation of 0.995 confirms in the scatter plot: there is very strong, positive relationship between two variables.
Chapter 3 Solutions
The Practice of Statistics for AP - 4th Edition
Additional Math Textbook Solutions
Fundamentals of Statistics (5th Edition)
Intro Stats, Books a la Carte Edition (5th Edition)
Elementary Statistics: Picturing the World (7th Edition)
Elementary Statistics
Essentials of Statistics, Books a la Carte Edition (5th Edition)
Introductory Statistics (2nd Edition)


 MATLAB: An Introduction with ApplicationsStatisticsISBN:9781119256830Author:Amos GilatPublisher:John Wiley & Sons Inc
 Probability and Statistics for Engineering and th...StatisticsISBN:9781305251809Author:Jay L. DevorePublisher:Cengage Learning
 Statistics for The Behavioral Sciences (MindTap C...StatisticsISBN:9781305504912Author:Frederick J Gravetter, Larry B. WallnauPublisher:Cengage Learning
 Elementary Statistics: Picturing the World (7th E...StatisticsISBN:9780134683416Author:Ron Larson, Betsy FarberPublisher:PEARSON
 The Basic Practice of StatisticsStatisticsISBN:9781319042578Author:David S. Moore, William I. Notz, Michael A. FlignerPublisher:W. H. Freeman
 Introduction to the Practice of StatisticsStatisticsISBN:9781319013387Author:David S. Moore, George P. McCabe, Bruce A. CraigPublisher:W. H. Freeman