
a.
To examine: The graph of
The graph is symmetric around
Given information:
The binomial probability formula:
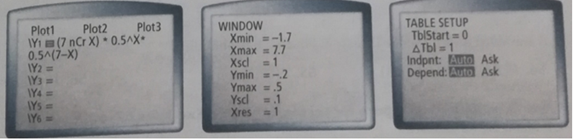
Explanation:
The graph of
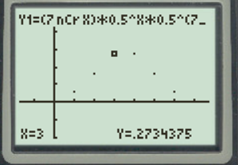
Press [2nd] and then [Calc] to get the maximum value , which is at
The right portion of the distribution is equal to the left portion of the distribution for the axis of symmetry of
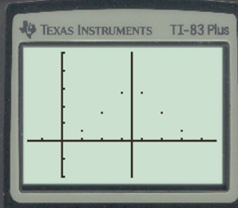
The graph is symmetric around
b.
To verify: The symmetry by displaying values of the function in table form.
One output of the function is associated with two input values. Thus, symmetry is verified.
Explanation:
| x | |
| 0 | 0.0078125 |
| 1 | 0.0546875 |
| 2 | 0.1640625 |
| 3 | 0.2734375 |
| 4 | 0.2734375 |
| 5 | 0.1640625 |
| 6 | 0.0546875 |
| 7 | 0.0078125 |
One output of the function is associated with two input values.
c.
To change: The graph to
The graph is left skewed. The graph does not have any symmetry.
Explanation:
Use the command shown in the picture to graph
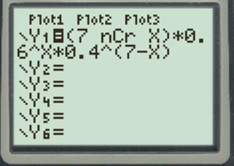
The graph of is shown.
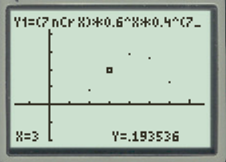
The left tail is quite longer than the right tail.
The graph is left skewed.
Chapter 11 Solutions
High School Math 2015 Common Core Algebra 2 Student Edition Grades 10/11

 Algebra and Trigonometry (6th Edition)AlgebraISBN:9780134463216Author:Robert F. BlitzerPublisher:PEARSON
 Contemporary Abstract AlgebraAlgebraISBN:9781305657960Author:Joseph GallianPublisher:Cengage Learning
 Linear Algebra: A Modern IntroductionAlgebraISBN:9781285463247Author:David PoolePublisher:Cengage Learning
 Algebra And Trigonometry (11th Edition)AlgebraISBN:9780135163078Author:Michael SullivanPublisher:PEARSON
 Introduction to Linear Algebra, Fifth EditionAlgebraISBN:9780980232776Author:Gilbert StrangPublisher:Wellesley-Cambridge Press
 College Algebra (Collegiate Math)AlgebraISBN:9780077836344Author:Julie Miller, Donna GerkenPublisher:McGraw-Hill Education